29
/
en
AIzaSyAYiBZKx7MnpbEhh9jyipgxe19OcubqV5w
April 1, 2024
150407
Honduras
HND
true
2
1
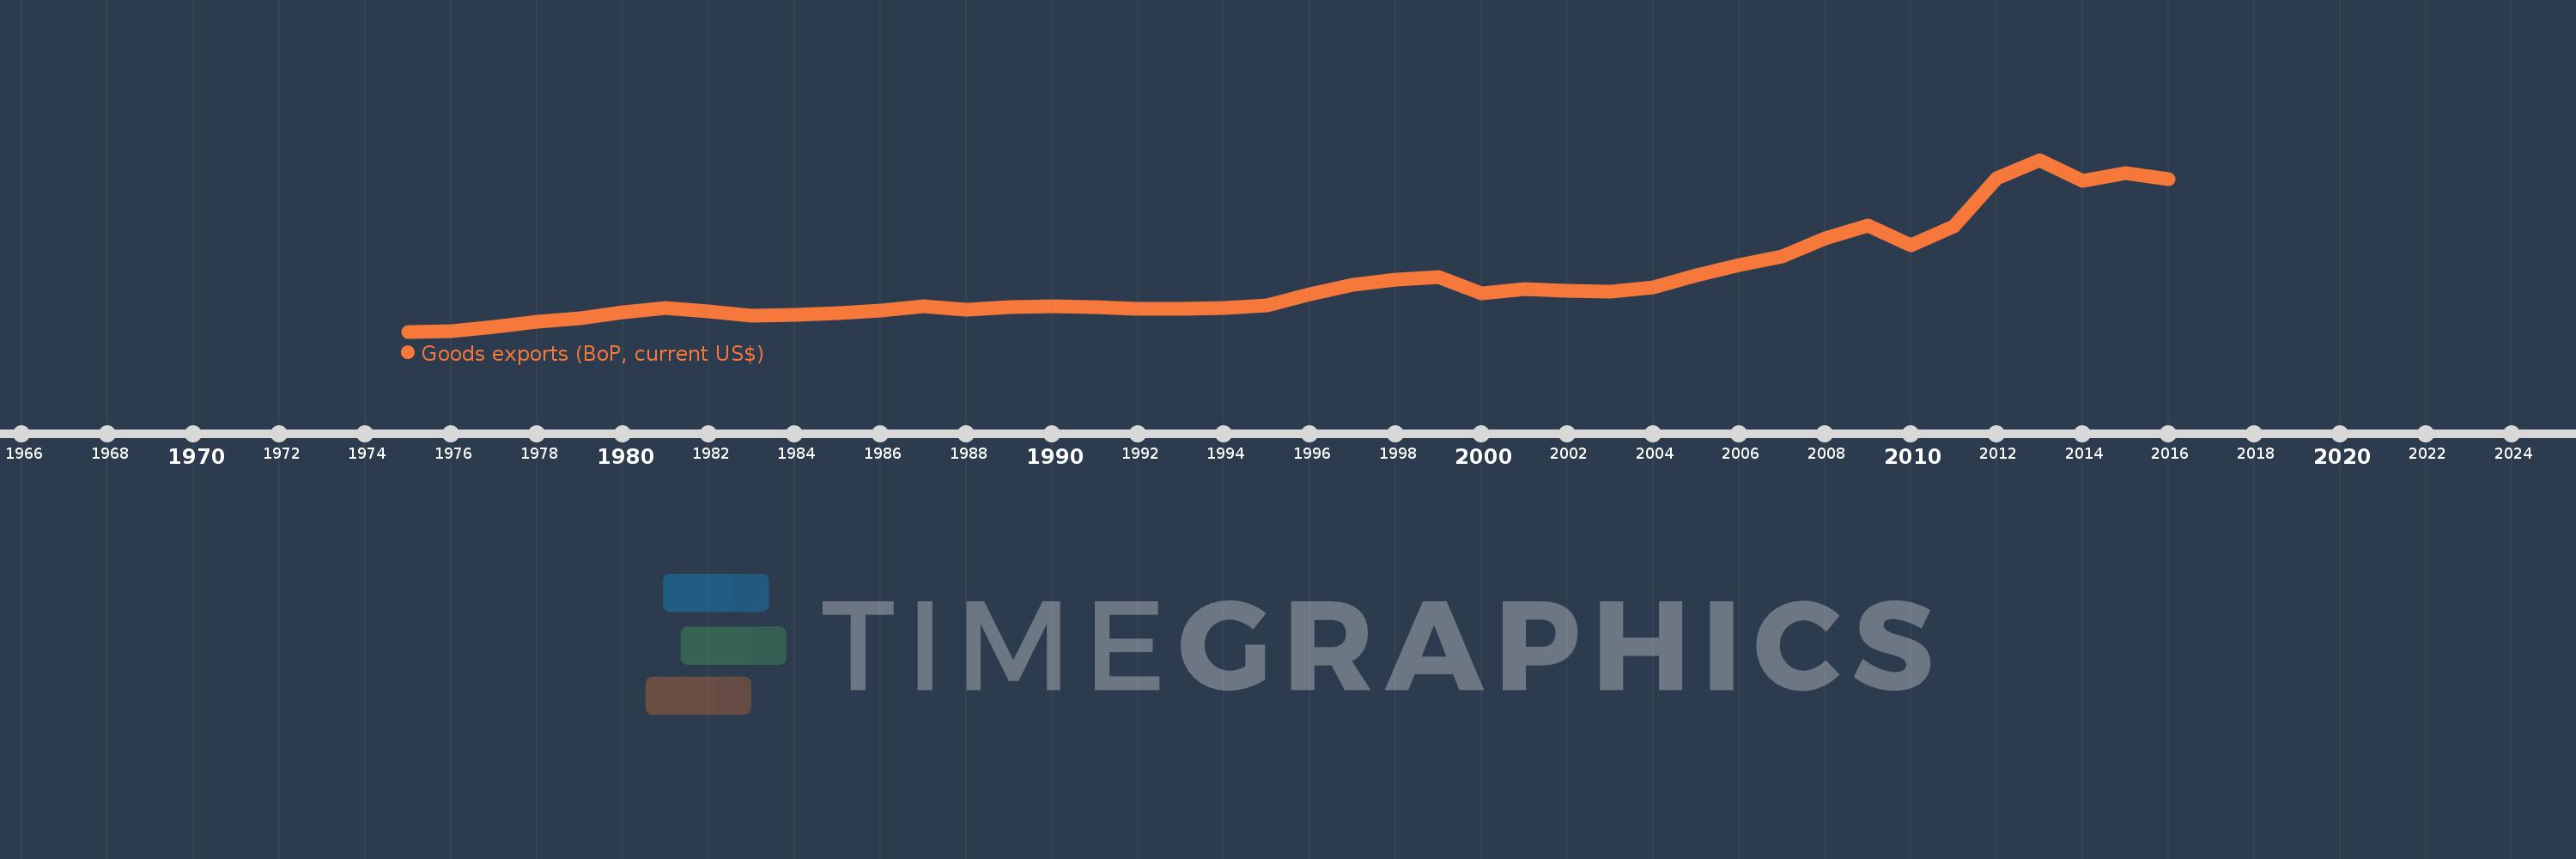
Goods exports (BoP, current US$)
2016,2015,2014,2013,2012,2011,2010,2009,2008,2007,2006,2005,2004,2003,2002,2001,2000,1999,1998,1997,1996,1995,1994,1993,1992,1991,1990,1989,1988,1987,1986,1985,1984,1983,1982,1981,1980,1979,1978,1977,1976,1975
This statistics in other country:
AfghanistanAlbaniaAlgeriaAngolaAntigua and BarbudaArab WorldArgentinaArmeniaArubaAustraliaAustriaAzerbaijanBahamas, TheBahrainBangladeshBarbadosBelarusBelgiumBelizeBeninBermudaBhutanBoliviaBosnia and HerzegovinaBotswanaBrazilBrunei DarussalamBulgariaBurkina FasoBurundiCabo VerdeCambodiaCameroonCanadaCaribbean small statesCentral African RepublicCentral Europe and the BalticsChadChileChinaColombiaComorosCongo, Dem. Rep.Congo, Rep.Costa RicaCote d'IvoireCroatiaCuracaoCyprusCzech RepublicDenmarkDjiboutiDominicaDominican RepublicEarly-demographic dividendEast Asia & PacificEast Asia & Pacific (excluding high income)East Asia & Pacific (IDA & IBRD countries)EcuadorEgypt, Arab Rep.El SalvadorEquatorial GuineaEritreaEstoniaEthiopiaEuro areaEurope & Central AsiaEurope & Central Asia (excluding high income)Europe & Central Asia (IDA & IBRD countries)European UnionFaroe IslandsFijiFinlandFragile and conflict affected situationsFranceFrench PolynesiaGabonGambia, TheGeorgiaGermanyGhanaGreeceGrenadaGuatemalaGuineaGuinea-BissauGuyanaHaitiHeavily indebted poor countries (HIPC)High incomeHondurasHong Kong SAR, ChinaHungaryIBRD onlyIcelandIDA & IBRD totalIDA blendIDA onlyIDA totalIndiaIndonesiaIran, Islamic Rep.IraqIrelandIsraelItalyJamaicaJapanJordanKazakhstanKenyaKiribatiKorea, Rep.KosovoKuwaitKyrgyz RepublicLao PDRLate-demographic dividendLatin America & Caribbean Latin America & Caribbean (excluding high income)Latin America & the Caribbean (IDA & IBRD countries)LatviaLeast developed countries: UN classificationLebanonLesothoLiberiaLibyaLithuaniaLow & middle incomeLow incomeLower middle incomeLuxembourgMacao SAR, ChinaMacedonia, FYRMadagascarMalawiMalaysiaMaldivesMaliMaltaMarshall IslandsMauritaniaMauritiusMexicoMicronesia, Fed. Sts.Middle East & North Africa (excluding high income)Middle East & North Africa (IDA & IBRD countries)Middle incomeMoldovaMongoliaMontenegroMoroccoMozambiqueMyanmarNamibiaNepalNetherlandsNew CaledoniaNew ZealandNicaraguaNigerNigeriaNorth AmericaNorwayOECD membersOmanPacific island small statesPakistanPalauPanamaPapua New GuineaParaguayPeruPhilippinesPolandPortugalPost-demographic dividendPre-demographic dividendQatarRomaniaRussian FederationRwandaSamoaSao Tome and PrincipeSaudi ArabiaSenegalSerbiaSeychellesSierra LeoneSingaporeSint Maarten (Dutch part)Slovak RepublicSloveniaSolomon IslandsSouth AfricaSouth AsiaSouth Asia (IDA & IBRD)South SudanSpainSri LankaSt. Kitts and NevisSt. LuciaSt. Vincent and the GrenadinesSub-Saharan Africa Sub-Saharan Africa (excluding high income)Sub-Saharan Africa (IDA & IBRD countries)SudanSurinameSwazilandSwedenSwitzerlandSyrian Arab RepublicTajikistanTanzaniaThailandTimor-LesteTogoTongaTrinidad and TobagoTunisiaTurkeyTuvaluUgandaUkraineUnited KingdomUnited StatesUpper middle incomeUruguayVanuatuVenezuela, RBVietnamWest Bank and GazaWorldYemen, Rep.ZambiaZimbabwe Timeline:
This timeline shows a graph from 1975 to 2016 of Honduras. No data until 1974. Number of actual observations by date: 42.
Source name:
World Development Indicators
Source organization:
International Monetary Fund, Balance of Payments Statistics Yearbook and data files.
Categories, topics:
Economy & Growth, Trade
Last updated:
apr 23, 2017
Indicators value changes by year
Minimum:
303.95 mln
jan 1, 1975
Maximum:
4.42 bln
jan 1, 2013
At the date of observation
Value
Absolute change
Change from previous value
jan 1, 1975
303.95 mln
+303.95 mln
0.0%
jan 1, 1976
313.1 mln
+9.15 mln
3.01%
jan 1, 1977
415.5 mln
+102.4 mln
32.71%
jan 1, 1978
534.4 mln
+118.9 mln
28.62%
jan 1, 1979
631.2 mln
+96.8 mln
18.11%
jan 1, 1980
763.75 mln
+132.55 mln
21.0%
jan 1, 1981
860.1 mln
+96.35 mln
12.62%
jan 1, 1982
792.95 mln
-67.15 mln
-7.81%
jan 1, 1983
685.05 mln
-107.9 mln
-13.61%
jan 1, 1984
707.2 mln
+22.15 mln
3.23%
jan 1, 1985
746.2 mln
+39.0 mln
5.51%
jan 1, 1986
805.65 mln
+59.45 mln
7.97%
jan 1, 1987
902.1 mln
+96.45 mln
11.97%
jan 1, 1988
830.5 mln
-71.6 mln
-7.94%
jan 1, 1989
889.45 mln
+58.95 mln
7.1%
jan 1, 1990
911.2 mln
+21.75 mln
2.45%
jan 1, 1991
895.2 mln
-16.0 mln
-1.76%
jan 1, 1992
840.6 mln
-54.6 mln
-6.1%
jan 1, 1993
839.3 mln
-1.3 mln
-0.15%
jan 1, 1994
872.8 mln
+33.5 mln
3.99%
jan 1, 1995
939.5 mln
+66.7 mln
7.64%
jan 1, 1996
1.19 bln
+250.2 mln
26.63%
jan 1, 1997
1.435 bln
+244.8 mln
20.58%
jan 1, 1998
1.549 bln
+114.1 mln
7.95%
jan 1, 1999
1.612 bln
+63.3 mln
4.09%
jan 1, 2000
1.218 bln
-394.1 mln
-24.45%
jan 1, 2001
1.315 bln
+96.905 mln
7.96%
jan 1, 2002
1.284 bln
-30.209 mln
-2.3%
jan 1, 2003
1.26 bln
-24.121 mln
-1.88%
jan 1, 2004
1.364 bln
+104.116 mln
8.26%
jan 1, 2005
1.647 bln
+282.45 mln
20.7%
jan 1, 2006
1.9 bln
+253.401 mln
15.39%
jan 1, 2007
2.109 bln
+208.408 mln
10.97%
jan 1, 2008
2.543 bln
+433.925 mln
20.58%
jan 1, 2009
2.848 bln
+305.499 mln
12.01%
jan 1, 2010
2.375 bln
-473.146 mln
-16.61%
jan 1, 2011
2.832 bln
+456.709 mln
19.23%
jan 1, 2012
3.978 bln
+1.146 bln
40.46%
jan 1, 2013
4.42 bln
+442.206 mln
11.12%
jan 1, 2014
3.916 bln
-503.942 mln
-11.4%
jan 1, 2015
4.092 bln
+176.332 mln
4.5%
jan 1, 2016
3.954 bln
-138.396 mln
-3.38%
Ranking of countries by current statistics by years


Comments: