29
/
en
AIzaSyAYiBZKx7MnpbEhh9jyipgxe19OcubqV5w
April 1, 2024
216459
Pakistan
PAK
true
2
1
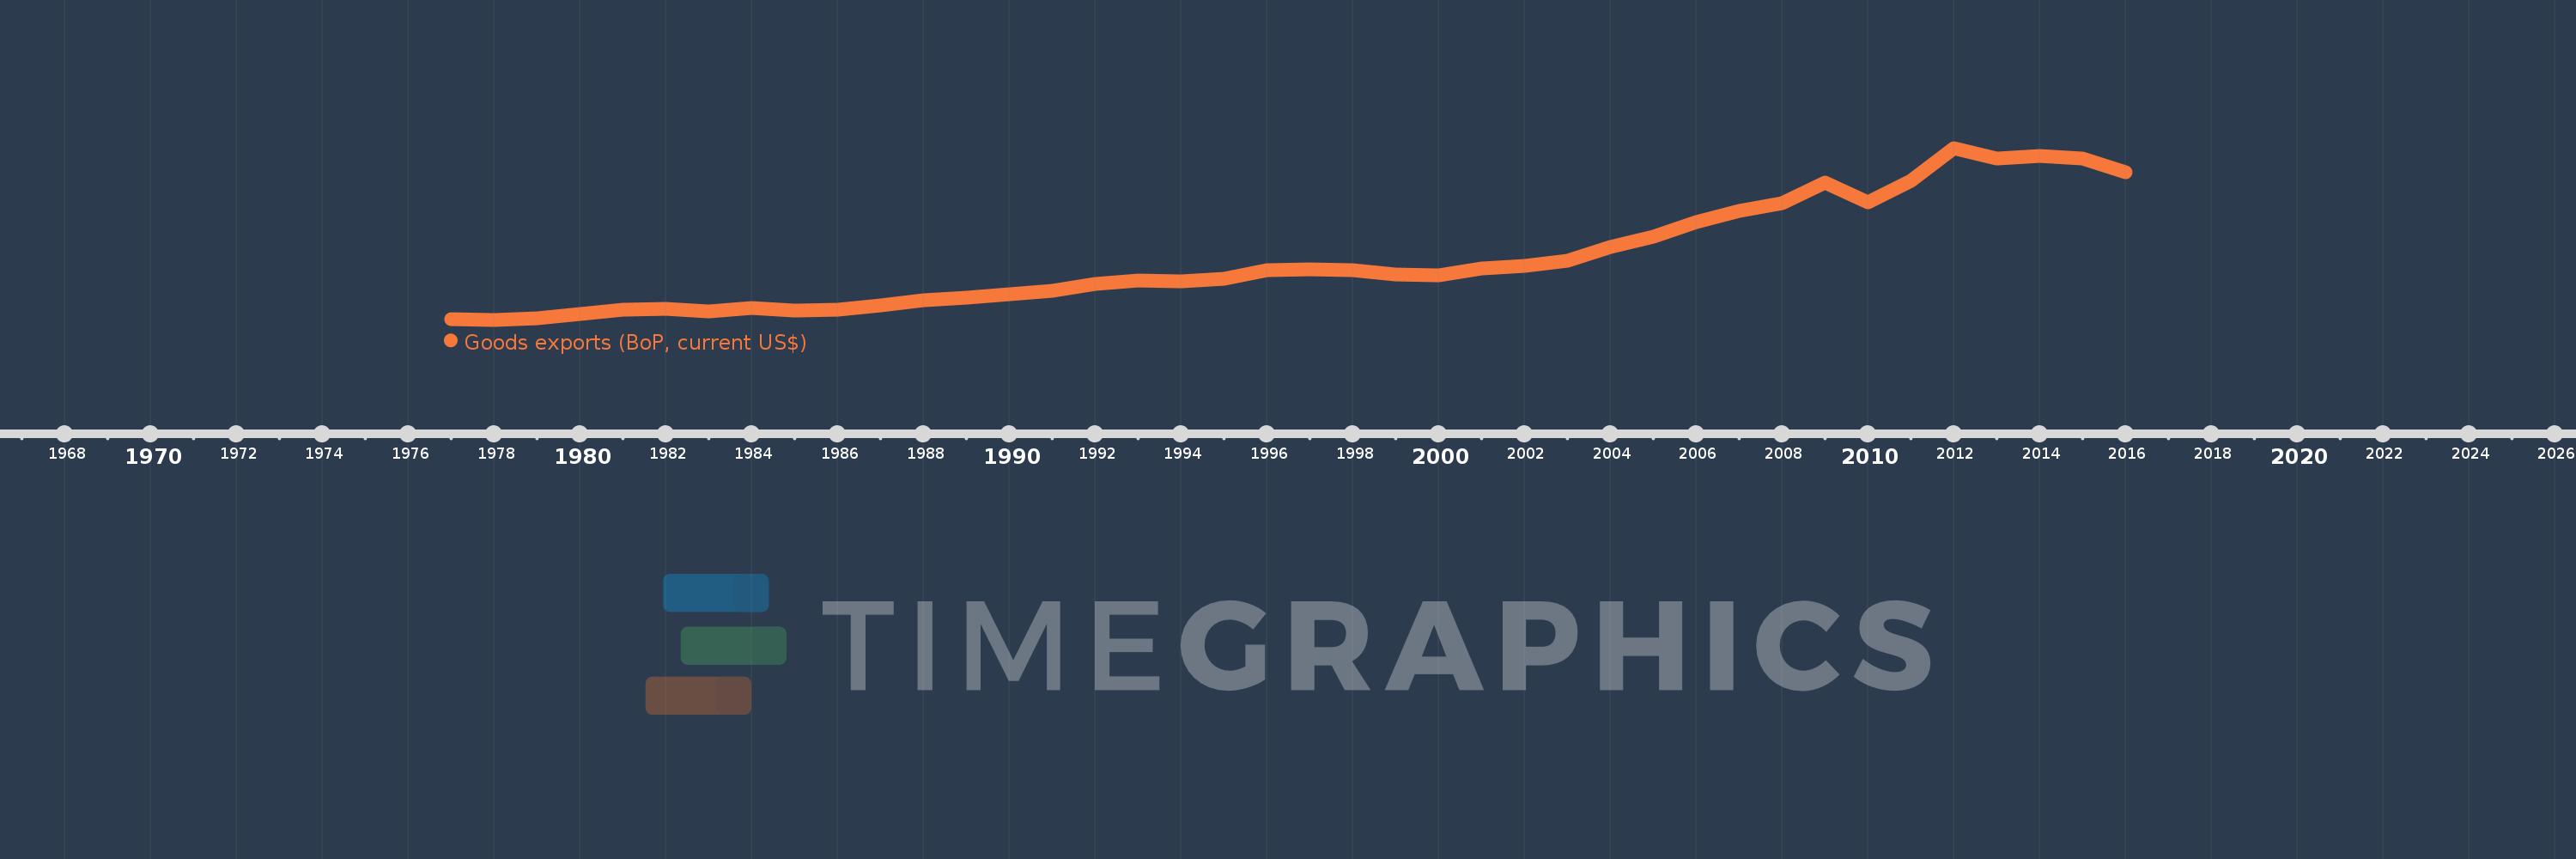
Goods exports (BoP, current US$)
2016,2015,2014,2013,2012,2011,2010,2009,2008,2007,2006,2005,2004,2003,2002,2001,2000,1999,1998,1997,1996,1995,1994,1993,1992,1991,1990,1989,1988,1987,1986,1985,1984,1983,1982,1981,1980,1979,1978,1977
This statistics in other country:
AfghanistanAlbaniaAlgeriaAngolaAntigua and BarbudaArab WorldArgentinaArmeniaArubaAustraliaAustriaAzerbaijanBahamas, TheBahrainBangladeshBarbadosBelarusBelgiumBelizeBeninBermudaBhutanBoliviaBosnia and HerzegovinaBotswanaBrazilBrunei DarussalamBulgariaBurkina FasoBurundiCabo VerdeCambodiaCameroonCanadaCaribbean small statesCentral African RepublicCentral Europe and the BalticsChadChileChinaColombiaComorosCongo, Dem. Rep.Congo, Rep.Costa RicaCote d'IvoireCroatiaCuracaoCyprusCzech RepublicDenmarkDjiboutiDominicaDominican RepublicEarly-demographic dividendEast Asia & PacificEast Asia & Pacific (excluding high income)East Asia & Pacific (IDA & IBRD countries)EcuadorEgypt, Arab Rep.El SalvadorEquatorial GuineaEritreaEstoniaEthiopiaEuro areaEurope & Central AsiaEurope & Central Asia (excluding high income)Europe & Central Asia (IDA & IBRD countries)European UnionFaroe IslandsFijiFinlandFragile and conflict affected situationsFranceFrench PolynesiaGabonGambia, TheGeorgiaGermanyGhanaGreeceGrenadaGuatemalaGuineaGuinea-BissauGuyanaHaitiHeavily indebted poor countries (HIPC)High incomeHondurasHong Kong SAR, ChinaHungaryIBRD onlyIcelandIDA & IBRD totalIDA blendIDA onlyIDA totalIndiaIndonesiaIran, Islamic Rep.IraqIrelandIsraelItalyJamaicaJapanJordanKazakhstanKenyaKiribatiKorea, Rep.KosovoKuwaitKyrgyz RepublicLao PDRLate-demographic dividendLatin America & Caribbean Latin America & Caribbean (excluding high income)Latin America & the Caribbean (IDA & IBRD countries)LatviaLeast developed countries: UN classificationLebanonLesothoLiberiaLibyaLithuaniaLow & middle incomeLow incomeLower middle incomeLuxembourgMacao SAR, ChinaMacedonia, FYRMadagascarMalawiMalaysiaMaldivesMaliMaltaMarshall IslandsMauritaniaMauritiusMexicoMicronesia, Fed. Sts.Middle East & North Africa (excluding high income)Middle East & North Africa (IDA & IBRD countries)Middle incomeMoldovaMongoliaMontenegroMoroccoMozambiqueMyanmarNamibiaNepalNetherlandsNew CaledoniaNew ZealandNicaraguaNigerNigeriaNorth AmericaNorwayOECD membersOmanPacific island small statesPakistanPalauPanamaPapua New GuineaParaguayPeruPhilippinesPolandPortugalPost-demographic dividendPre-demographic dividendQatarRomaniaRussian FederationRwandaSamoaSao Tome and PrincipeSaudi ArabiaSenegalSerbiaSeychellesSierra LeoneSingaporeSint Maarten (Dutch part)Slovak RepublicSloveniaSolomon IslandsSouth AfricaSouth AsiaSouth Asia (IDA & IBRD)South SudanSpainSri LankaSt. Kitts and NevisSt. LuciaSt. Vincent and the GrenadinesSub-Saharan Africa Sub-Saharan Africa (excluding high income)Sub-Saharan Africa (IDA & IBRD countries)SudanSurinameSwazilandSwedenSwitzerlandSyrian Arab RepublicTajikistanTanzaniaThailandTimor-LesteTogoTongaTrinidad and TobagoTunisiaTurkeyTuvaluUgandaUkraineUnited KingdomUnited StatesUpper middle incomeUruguayVanuatuVenezuela, RBVietnamWest Bank and GazaWorldYemen, Rep.ZambiaZimbabwe Timeline:
This timeline shows a graph from 1977 to 2016 of Pakistan. No data until 1976. Number of actual observations by date: 40.
Source name:
World Development Indicators
Source organization:
International Monetary Fund, Balance of Payments Statistics Yearbook and data files.
Categories, topics:
Economy & Growth, Trade
Last updated:
apr 23, 2017
Indicators value changes by year
Minimum:
1.127 bln
jan 1, 1978
Maximum:
26.328 bln
jan 1, 2012
At the date of observation
Value
Absolute change
Change from previous value
jan 1, 1977
1.172 bln
+1.172 bln
0.0%
jan 1, 1978
1.127 bln
-45.568 mln
-3.89%
jan 1, 1979
1.404 bln
+277.164 mln
24.6%
jan 1, 1980
1.957 bln
+553.414 mln
39.43%
jan 1, 1981
2.581 bln
+623.847 mln
31.88%
jan 1, 1982
2.743 bln
+162.178 mln
6.28%
jan 1, 1983
2.352 bln
-391.373 mln
-14.27%
jan 1, 1984
2.89 bln
+538.457 mln
22.9%
jan 1, 1985
2.492 bln
-398.099 mln
-13.77%
jan 1, 1986
2.661 bln
+168.463 mln
6.76%
jan 1, 1987
3.206 bln
+545.327 mln
20.5%
jan 1, 1988
3.956 bln
+750.476 mln
23.41%
jan 1, 1989
4.426 bln
+469.218 mln
11.86%
jan 1, 1990
4.818 bln
+392.606 mln
8.87%
jan 1, 1991
5.405 bln
+587.239 mln
12.19%
jan 1, 1992
6.411 bln
+1.005 bln
18.6%
jan 1, 1993
6.913 bln
+502.25 mln
7.83%
jan 1, 1994
6.793 bln
-119.681 mln
-1.73%
jan 1, 1995
7.117 bln
+323.344 mln
4.76%
jan 1, 1996
8.356 bln
+1.24 bln
17.42%
jan 1, 1997
8.507 bln
+150.922 mln
1.81%
jan 1, 1998
8.351 bln
-156.538 mln
-1.84%
jan 1, 1999
7.796 bln
-554.731 mln
-6.64%
jan 1, 2000
7.615 bln
-181.0 mln
-2.32%
jan 1, 2001
8.657 bln
+1.042 bln
13.68%
jan 1, 2002
9.053 bln
+396.0 mln
4.57%
jan 1, 2003
9.773 bln
+720.0 mln
7.95%
jan 1, 2004
11.836 bln
+2.063 bln
21.11%
jan 1, 2005
13.281 bln
+1.445 bln
12.21%
jan 1, 2006
15.441 bln
+2.16 bln
16.26%
jan 1, 2007
17.065 bln
+1.624 bln
10.52%
jan 1, 2008
18.218 bln
+1.153 bln
6.76%
jan 1, 2009
21.224 bln
+3.006 bln
16.5%
jan 1, 2010
18.356 bln
-2.868 bln
-13.51%
jan 1, 2011
21.481 bln
+3.125 bln
17.02%
jan 1, 2012
26.328 bln
+4.847 bln
22.56%
jan 1, 2013
24.792 bln
-1.536 bln
-5.83%
jan 1, 2014
25.115 bln
+323.0 mln
1.3%
jan 1, 2015
24.777 bln
-338.0 mln
-1.35%
jan 1, 2016
22.73 bln
-2.047 bln
-8.26%
Ranking of countries by current statistics by years


Comments: