29
/
en
AIzaSyAYiBZKx7MnpbEhh9jyipgxe19OcubqV5w
April 1, 2024
251918
St. Vincent and the Grenadines
VCT
true
2
1
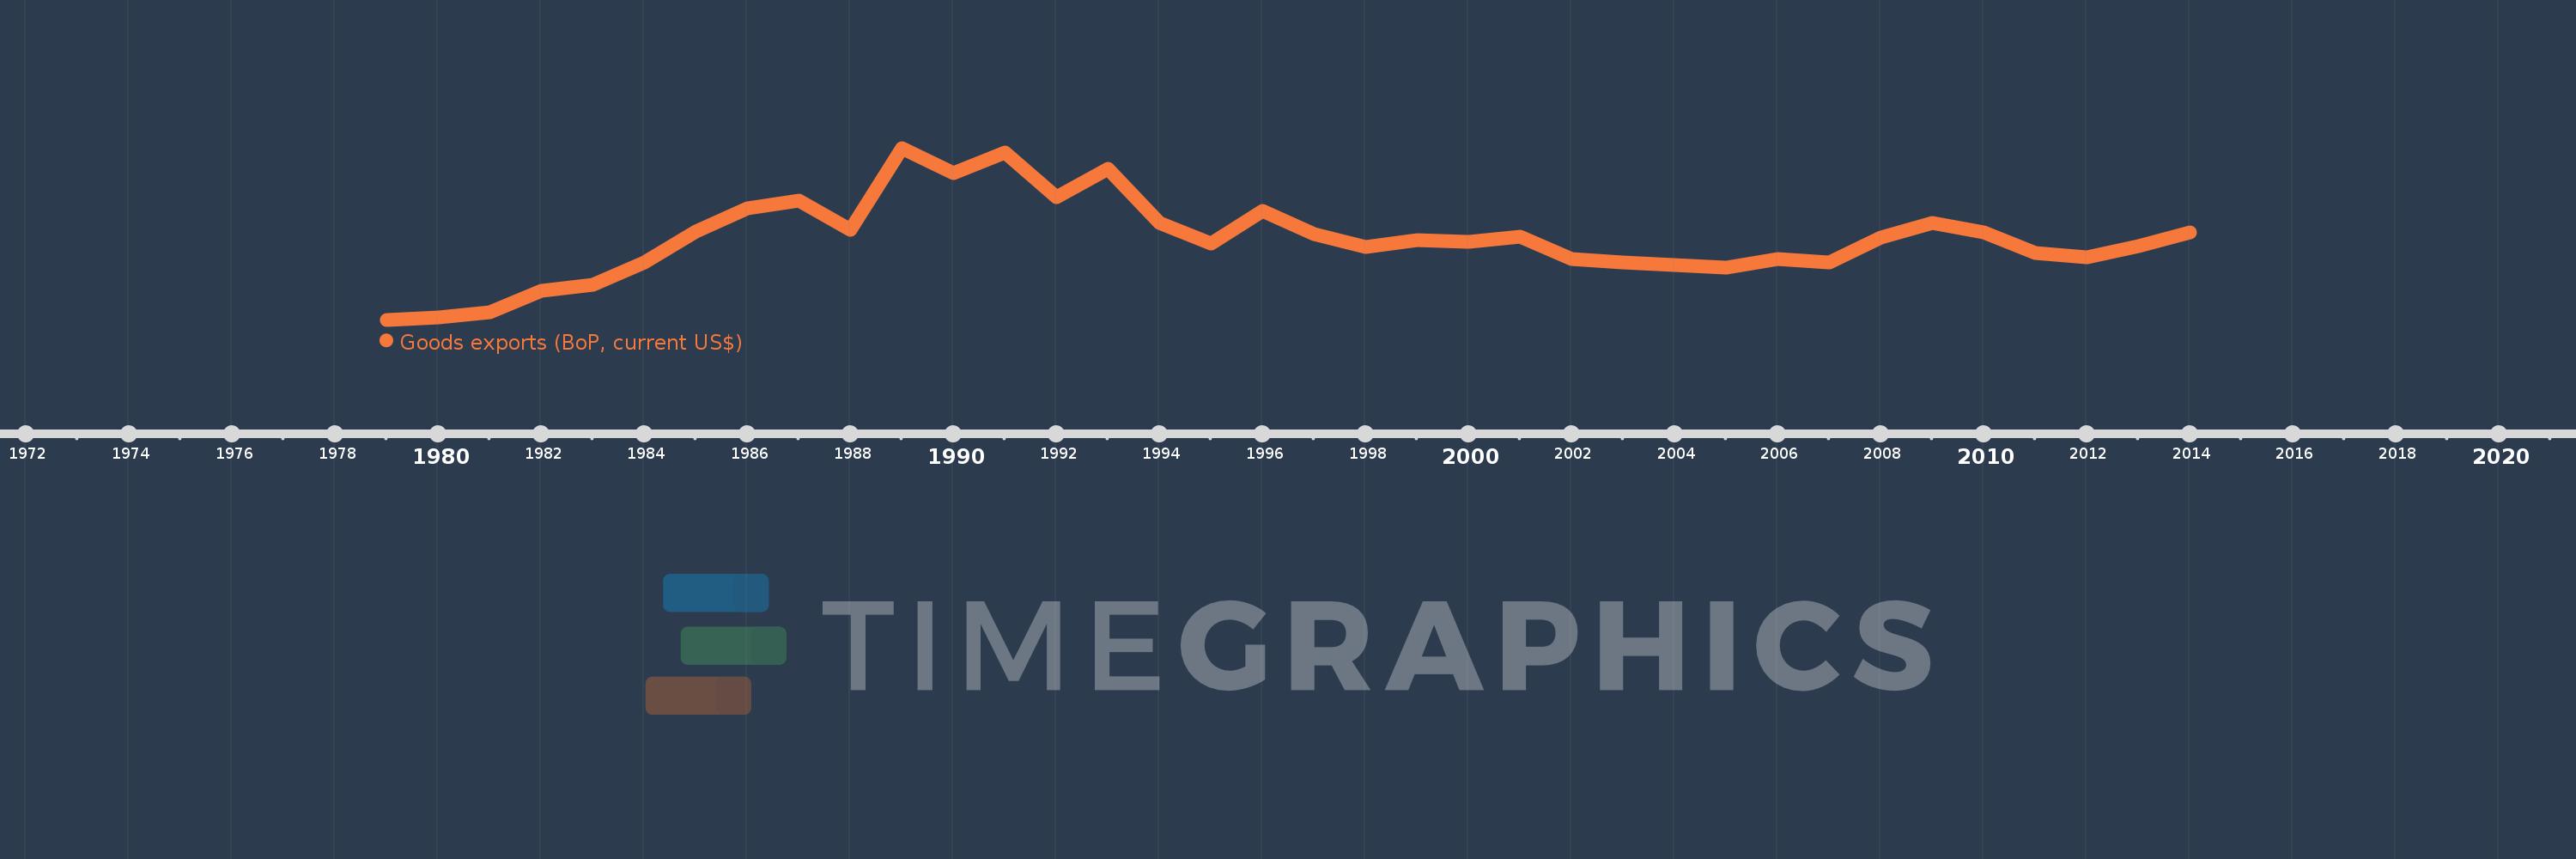
Goods exports (BoP, current US$)
2014,2013,2012,2011,2010,2009,2008,2007,2006,2005,2004,2003,2002,2001,2000,1999,1998,1997,1996,1995,1994,1993,1992,1991,1990,1989,1988,1987,1986,1985,1984,1983,1982,1981,1980,1979
This statistics in other country:
AfghanistanAlbaniaAlgeriaAngolaAntigua and BarbudaArab WorldArgentinaArmeniaArubaAustraliaAustriaAzerbaijanBahamas, TheBahrainBangladeshBarbadosBelarusBelgiumBelizeBeninBermudaBhutanBoliviaBosnia and HerzegovinaBotswanaBrazilBrunei DarussalamBulgariaBurkina FasoBurundiCabo VerdeCambodiaCameroonCanadaCaribbean small statesCentral African RepublicCentral Europe and the BalticsChadChileChinaColombiaComorosCongo, Dem. Rep.Congo, Rep.Costa RicaCote d'IvoireCroatiaCuracaoCyprusCzech RepublicDenmarkDjiboutiDominicaDominican RepublicEarly-demographic dividendEast Asia & PacificEast Asia & Pacific (excluding high income)East Asia & Pacific (IDA & IBRD countries)EcuadorEgypt, Arab Rep.El SalvadorEquatorial GuineaEritreaEstoniaEthiopiaEuro areaEurope & Central AsiaEurope & Central Asia (excluding high income)Europe & Central Asia (IDA & IBRD countries)European UnionFaroe IslandsFijiFinlandFragile and conflict affected situationsFranceFrench PolynesiaGabonGambia, TheGeorgiaGermanyGhanaGreeceGrenadaGuatemalaGuineaGuinea-BissauGuyanaHaitiHeavily indebted poor countries (HIPC)High incomeHondurasHong Kong SAR, ChinaHungaryIBRD onlyIcelandIDA & IBRD totalIDA blendIDA onlyIDA totalIndiaIndonesiaIran, Islamic Rep.IraqIrelandIsraelItalyJamaicaJapanJordanKazakhstanKenyaKiribatiKorea, Rep.KosovoKuwaitKyrgyz RepublicLao PDRLate-demographic dividendLatin America & Caribbean Latin America & Caribbean (excluding high income)Latin America & the Caribbean (IDA & IBRD countries)LatviaLeast developed countries: UN classificationLebanonLesothoLiberiaLibyaLithuaniaLow & middle incomeLow incomeLower middle incomeLuxembourgMacao SAR, ChinaMacedonia, FYRMadagascarMalawiMalaysiaMaldivesMaliMaltaMarshall IslandsMauritaniaMauritiusMexicoMicronesia, Fed. Sts.Middle East & North Africa (excluding high income)Middle East & North Africa (IDA & IBRD countries)Middle incomeMoldovaMongoliaMontenegroMoroccoMozambiqueMyanmarNamibiaNepalNetherlandsNew CaledoniaNew ZealandNicaraguaNigerNigeriaNorth AmericaNorwayOECD membersOmanPacific island small statesPakistanPalauPanamaPapua New GuineaParaguayPeruPhilippinesPolandPortugalPost-demographic dividendPre-demographic dividendQatarRomaniaRussian FederationRwandaSamoaSao Tome and PrincipeSaudi ArabiaSenegalSerbiaSeychellesSierra LeoneSingaporeSint Maarten (Dutch part)Slovak RepublicSloveniaSolomon IslandsSouth AfricaSouth AsiaSouth Asia (IDA & IBRD)South SudanSpainSri LankaSt. Kitts and NevisSt. LuciaSt. Vincent and the GrenadinesSub-Saharan Africa Sub-Saharan Africa (excluding high income)Sub-Saharan Africa (IDA & IBRD countries)SudanSurinameSwazilandSwedenSwitzerlandSyrian Arab RepublicTajikistanTanzaniaThailandTimor-LesteTogoTongaTrinidad and TobagoTunisiaTurkeyTuvaluUgandaUkraineUnited KingdomUnited StatesUpper middle incomeUruguayVanuatuVenezuela, RBVietnamWest Bank and GazaWorldYemen, Rep.ZambiaZimbabwe Timeline:
This timeline shows a graph from 1979 to 2014 of St. Vincent and the Grenadines. No data until 1978. Number of actual observations by date: 36.
Source name:
World Development Indicators
Source organization:
International Monetary Fund, Balance of Payments Statistics Yearbook and data files.
Categories, topics:
Economy & Growth, Trade
Last updated:
apr 23, 2017
Indicators value changes by year
Minimum:
18.1 mln
jan 1, 1979
Maximum:
87.407 mln
jan 1, 1989
At the date of observation
Value
Absolute change
Change from previous value
jan 1, 1979
18.1 mln
+18.1 mln
0.0%
jan 1, 1980
19.1 mln
+1000.0K
5.52%
jan 1, 1981
21.1 mln
+2.0 mln
10.47%
jan 1, 1982
29.8 mln
+8.7 mln
41.23%
jan 1, 1983
32.19 mln
+2.39 mln
8.02%
jan 1, 1984
41.1 mln
+8.91 mln
27.68%
jan 1, 1985
53.6 mln
+12.5 mln
30.41%
jan 1, 1986
63.2 mln
+9.6 mln
17.91%
jan 1, 1987
66.111 mln
+2.911 mln
4.61%
jan 1, 1988
54.37 mln
-11.741 mln
-17.76%
jan 1, 1989
87.407 mln
+33.037 mln
60.76%
jan 1, 1990
77.37 mln
-10.037 mln
-11.48%
jan 1, 1991
85.407 mln
+8.037 mln
10.39%
jan 1, 1992
67.422 mln
-17.985 mln
-21.06%
jan 1, 1993
79.026 mln
+11.604 mln
17.21%
jan 1, 1994
57.122 mln
-21.904 mln
-27.72%
jan 1, 1995
48.859 mln
-8.263 mln
-14.47%
jan 1, 1996
61.941 mln
+13.081 mln
26.77%
jan 1, 1997
52.556 mln
-9.385 mln
-15.15%
jan 1, 1998
47.285 mln
-5.27 mln
-10.03%
jan 1, 1999
50.093 mln
+2.807 mln
5.94%
jan 1, 2000
49.611 mln
-481.481K
-0.96%
jan 1, 2001
51.748 mln
+2.137 mln
4.31%
jan 1, 2002
42.74 mln
-9.008 mln
-17.41%
jan 1, 2003
41.224 mln
-1.516 mln
-3.55%
jan 1, 2004
40.088 mln
-1.136 mln
-2.76%
jan 1, 2005
39.294 mln
-793.347K
-1.98%
jan 1, 2006
42.568 mln
+3.273 mln
8.33%
jan 1, 2007
41.158 mln
-1.409 mln
-3.31%
jan 1, 2008
51.347 mln
+10.189 mln
24.76%
jan 1, 2009
57.183 mln
+5.836 mln
11.37%
jan 1, 2010
53.352 mln
-3.831 mln
-6.7%
jan 1, 2011
44.998 mln
-8.355 mln
-15.66%
jan 1, 2012
43.422 mln
-1.576 mln
-3.5%
jan 1, 2013
47.787 mln
+4.366 mln
10.05%
jan 1, 2014
53.355 mln
+5.568 mln
11.65%
Ranking of countries by current statistics by years


Comments: