29
/
en
AIzaSyAYiBZKx7MnpbEhh9jyipgxe19OcubqV5w
April 1, 2024
43451
Latin America & the Caribbean (IDA & IBRD countries)
TLA
false
2
1
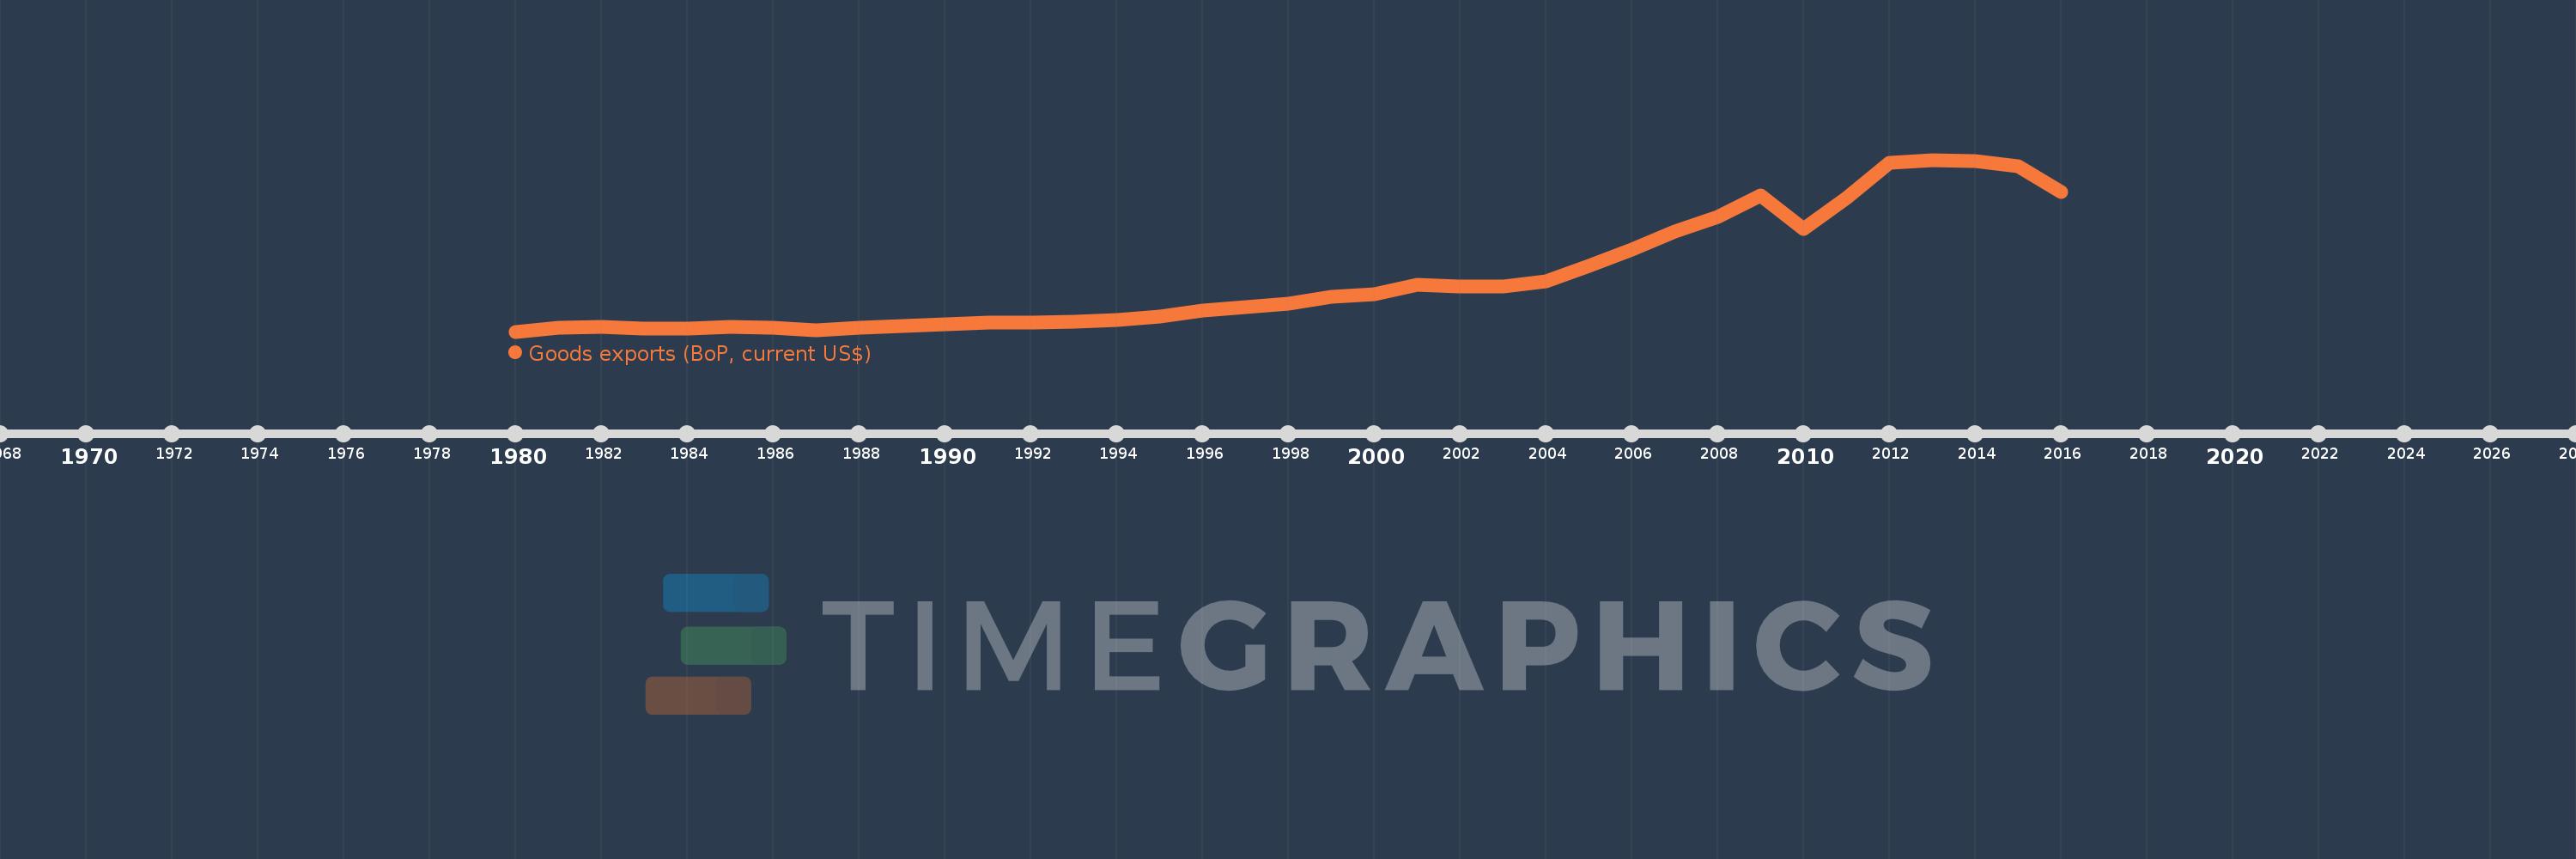
Goods exports (BoP, current US$)
2016,2015,2014,2013,2012,2011,2010,2009,2008,2007,2006,2005,2004,2003,2002,2001,2000,1999,1998,1997,1996,1995,1994,1993,1992,1991,1990,1989,1988,1987,1986,1985,1984,1983,1982,1981,1980
This statistics in other country:
AfghanistanAlbaniaAlgeriaAngolaAntigua and BarbudaArab WorldArgentinaArmeniaArubaAustraliaAustriaAzerbaijanBahamas, TheBahrainBangladeshBarbadosBelarusBelgiumBelizeBeninBermudaBhutanBoliviaBosnia and HerzegovinaBotswanaBrazilBrunei DarussalamBulgariaBurkina FasoBurundiCabo VerdeCambodiaCameroonCanadaCaribbean small statesCentral African RepublicCentral Europe and the BalticsChadChileChinaColombiaComorosCongo, Dem. Rep.Congo, Rep.Costa RicaCote d'IvoireCroatiaCuracaoCyprusCzech RepublicDenmarkDjiboutiDominicaDominican RepublicEarly-demographic dividendEast Asia & PacificEast Asia & Pacific (excluding high income)East Asia & Pacific (IDA & IBRD countries)EcuadorEgypt, Arab Rep.El SalvadorEquatorial GuineaEritreaEstoniaEthiopiaEuro areaEurope & Central AsiaEurope & Central Asia (excluding high income)Europe & Central Asia (IDA & IBRD countries)European UnionFaroe IslandsFijiFinlandFragile and conflict affected situationsFranceFrench PolynesiaGabonGambia, TheGeorgiaGermanyGhanaGreeceGrenadaGuatemalaGuineaGuinea-BissauGuyanaHaitiHeavily indebted poor countries (HIPC)High incomeHondurasHong Kong SAR, ChinaHungaryIBRD onlyIcelandIDA & IBRD totalIDA blendIDA onlyIDA totalIndiaIndonesiaIran, Islamic Rep.IraqIrelandIsraelItalyJamaicaJapanJordanKazakhstanKenyaKiribatiKorea, Rep.KosovoKuwaitKyrgyz RepublicLao PDRLate-demographic dividendLatin America & Caribbean Latin America & Caribbean (excluding high income)Latin America & the Caribbean (IDA & IBRD countries)LatviaLeast developed countries: UN classificationLebanonLesothoLiberiaLibyaLithuaniaLow & middle incomeLow incomeLower middle incomeLuxembourgMacao SAR, ChinaMacedonia, FYRMadagascarMalawiMalaysiaMaldivesMaliMaltaMarshall IslandsMauritaniaMauritiusMexicoMicronesia, Fed. Sts.Middle East & North Africa (excluding high income)Middle East & North Africa (IDA & IBRD countries)Middle incomeMoldovaMongoliaMontenegroMoroccoMozambiqueMyanmarNamibiaNepalNetherlandsNew CaledoniaNew ZealandNicaraguaNigerNigeriaNorth AmericaNorwayOECD membersOmanPacific island small statesPakistanPalauPanamaPapua New GuineaParaguayPeruPhilippinesPolandPortugalPost-demographic dividendPre-demographic dividendQatarRomaniaRussian FederationRwandaSamoaSao Tome and PrincipeSaudi ArabiaSenegalSerbiaSeychellesSierra LeoneSingaporeSint Maarten (Dutch part)Slovak RepublicSloveniaSolomon IslandsSouth AfricaSouth AsiaSouth Asia (IDA & IBRD)South SudanSpainSri LankaSt. Kitts and NevisSt. LuciaSt. Vincent and the GrenadinesSub-Saharan Africa Sub-Saharan Africa (excluding high income)Sub-Saharan Africa (IDA & IBRD countries)SudanSurinameSwazilandSwedenSwitzerlandSyrian Arab RepublicTajikistanTanzaniaThailandTimor-LesteTogoTongaTrinidad and TobagoTunisiaTurkeyTuvaluUgandaUkraineUnited KingdomUnited StatesUpper middle incomeUruguayVanuatuVenezuela, RBVietnamWest Bank and GazaWorldYemen, Rep.ZambiaZimbabwe Timeline:
This timeline shows a graph from 1980 to 2016 of Latin America & the Caribbean (IDA & IBRD countries). No data until 1979. Number of actual observations by date: 37.
Source name:
World Development Indicators
Source organization:
International Monetary Fund, Balance of Payments Statistics Yearbook and data files.
Categories, topics:
Economy & Growth, Trade
Last updated:
apr 23, 2017
Indicators value changes by year
Minimum:
70.944 bln
jan 1, 1980
Maximum:
1.119 trl
jan 1, 2013
At the date of observation
Value
Absolute change
Change from previous value
jan 1, 1980
70.944 bln
+70.944 bln
0.0%
jan 1, 1981
93.674 bln
+22.73 bln
32.04%
jan 1, 1982
101.122 bln
+7.448 bln
7.95%
jan 1, 1983
91.666 bln
-9.456 bln
-9.35%
jan 1, 1984
91.387 bln
-278.25 mln
-0.3%
jan 1, 1985
101.729 bln
+10.341 bln
11.32%
jan 1, 1986
95.9 bln
-5.829 bln
-5.73%
jan 1, 1987
80.745 bln
-15.155 bln
-15.8%
jan 1, 1988
91.973 bln
+11.228 bln
13.91%
jan 1, 1989
104.755 bln
+12.782 bln
13.9%
jan 1, 1990
115.014 bln
+10.259 bln
9.79%
jan 1, 1991
127.4 bln
+12.386 bln
10.77%
jan 1, 1992
126.19 bln
-1.21 bln
-0.95%
jan 1, 1993
132.764 bln
+6.574 bln
5.21%
jan 1, 1994
141.147 bln
+8.383 bln
6.31%
jan 1, 1995
163.309 bln
+22.162 bln
15.7%
jan 1, 1996
200.299 bln
+36.99 bln
22.65%
jan 1, 1997
221.312 bln
+21.013 bln
10.49%
jan 1, 1998
241.122 bln
+19.81 bln
8.95%
jan 1, 1999
281.734 bln
+40.613 bln
16.84%
jan 1, 2000
296.377 bln
+14.643 bln
5.2%
jan 1, 2001
358.713 bln
+62.336 bln
21.03%
jan 1, 2002
344.353 bln
-14.36 bln
-4.0%
jan 1, 2003
347.175 bln
+2.822 bln
0.82%
jan 1, 2004
378.829 bln
+31.654 bln
9.12%
jan 1, 2005
470.718 bln
+91.89 bln
24.26%
jan 1, 2006
569.815 bln
+99.097 bln
21.05%
jan 1, 2007
683.021 bln
+113.206 bln
19.87%
jan 1, 2008
770.128 bln
+87.106 bln
12.75%
jan 1, 2009
899.305 bln
+129.177 bln
16.77%
jan 1, 2010
696.974 bln
-202.331 bln
-22.5%
jan 1, 2011
888.063 bln
+191.089 bln
27.42%
jan 1, 2012
1.101 trl
+212.829 bln
23.97%
jan 1, 2013
1.119 trl
+18.518 bln
1.68%
jan 1, 2014
1.109 trl
-10.042 bln
-0.9%
jan 1, 2015
1.079 trl
-30.23 bln
-2.72%
jan 1, 2016
922.6 bln
-156.539 bln
-14.51%
Ranking of countries by current statistics by years


Comments: