29
/
en
AIzaSyAYiBZKx7MnpbEhh9jyipgxe19OcubqV5w
April 1, 2024
29112
East Asia & Pacific (IDA & IBRD countries)
TEA
false
2
1
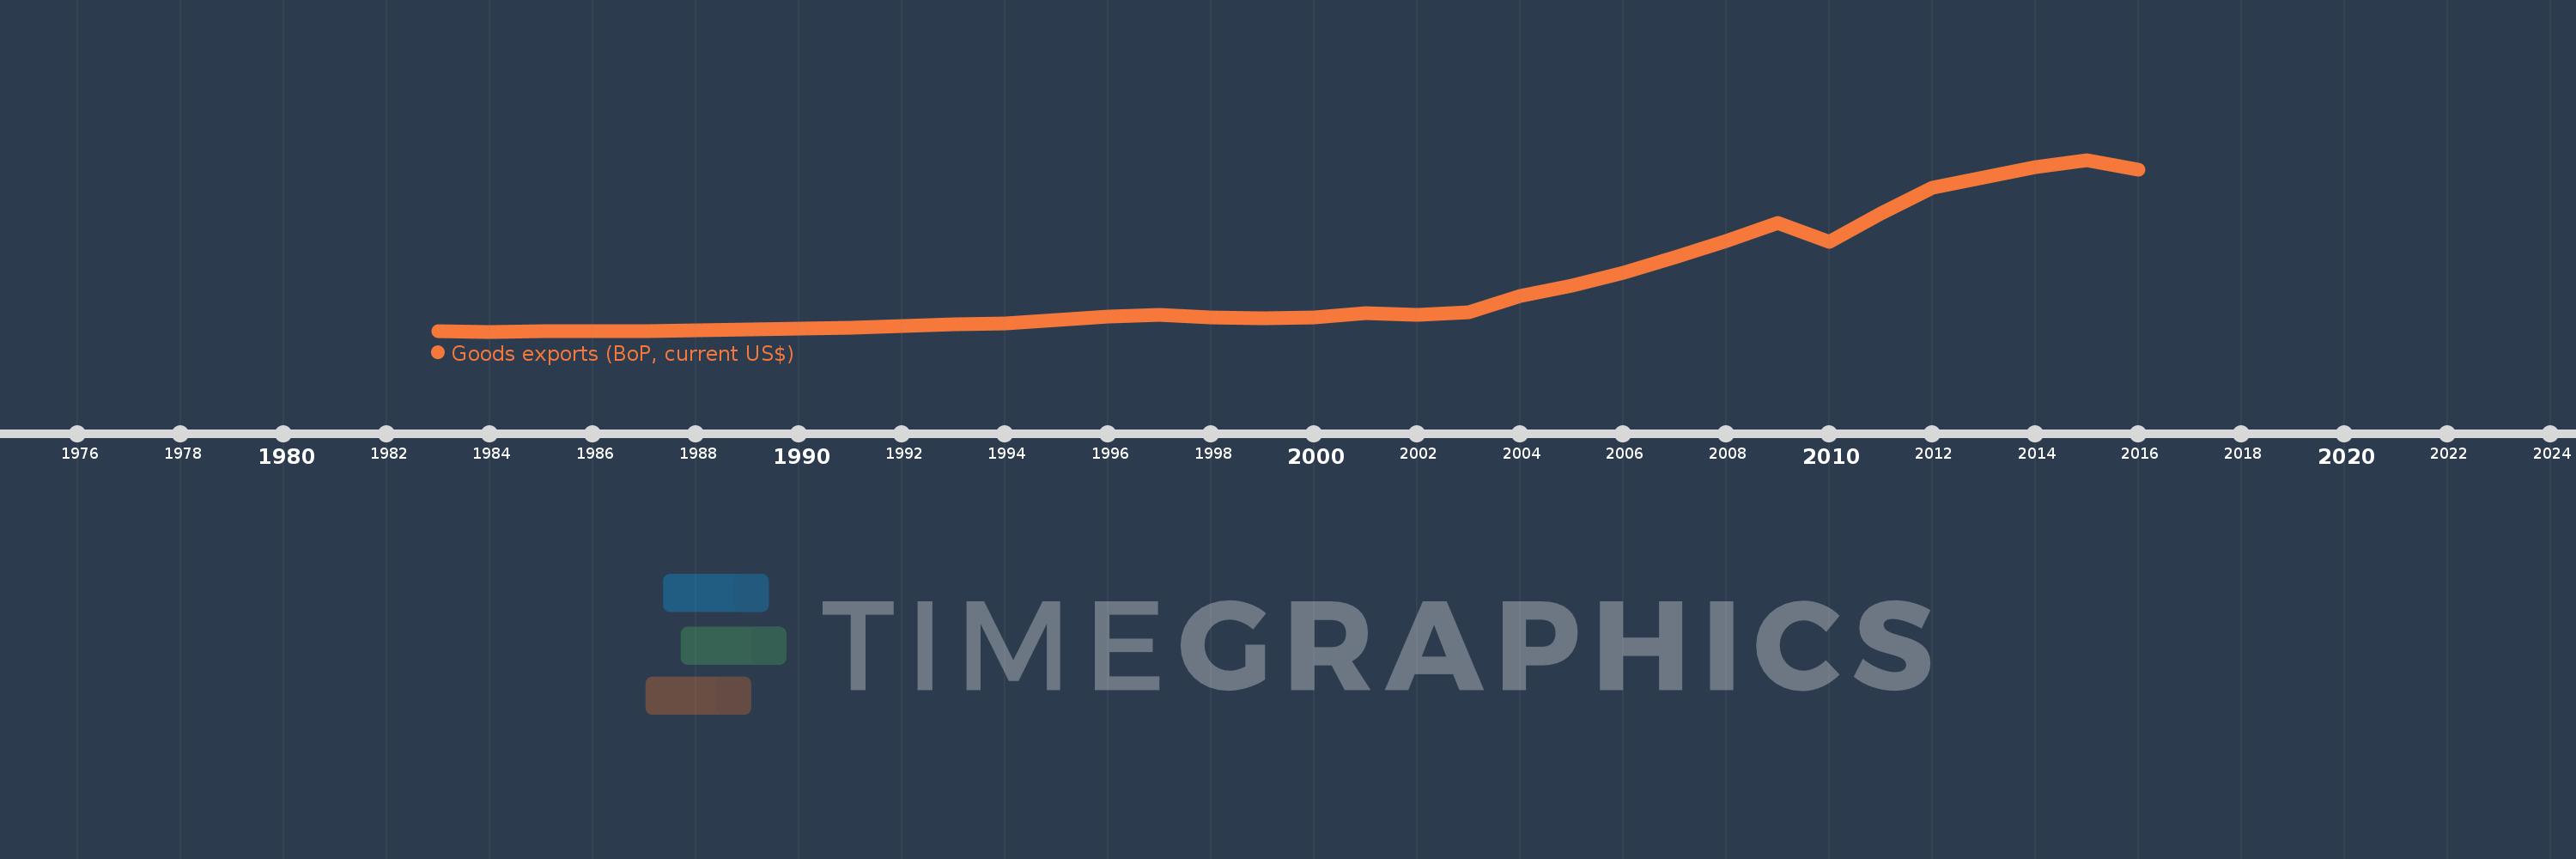
Goods exports (BoP, current US$)
2016,2015,2014,2013,2012,2011,2010,2009,2008,2007,2006,2005,2004,2003,2002,2001,2000,1999,1998,1997,1996,1995,1994,1993,1992,1991,1990,1989,1988,1987,1986,1985,1984,1983
This statistics in other country:
AfghanistanAlbaniaAlgeriaAngolaAntigua and BarbudaArab WorldArgentinaArmeniaArubaAustraliaAustriaAzerbaijanBahamas, TheBahrainBangladeshBarbadosBelarusBelgiumBelizeBeninBermudaBhutanBoliviaBosnia and HerzegovinaBotswanaBrazilBrunei DarussalamBulgariaBurkina FasoBurundiCabo VerdeCambodiaCameroonCanadaCaribbean small statesCentral African RepublicCentral Europe and the BalticsChadChileChinaColombiaComorosCongo, Dem. Rep.Congo, Rep.Costa RicaCote d'IvoireCroatiaCuracaoCyprusCzech RepublicDenmarkDjiboutiDominicaDominican RepublicEarly-demographic dividendEast Asia & PacificEast Asia & Pacific (excluding high income)East Asia & Pacific (IDA & IBRD countries)EcuadorEgypt, Arab Rep.El SalvadorEquatorial GuineaEritreaEstoniaEthiopiaEuro areaEurope & Central AsiaEurope & Central Asia (excluding high income)Europe & Central Asia (IDA & IBRD countries)European UnionFaroe IslandsFijiFinlandFragile and conflict affected situationsFranceFrench PolynesiaGabonGambia, TheGeorgiaGermanyGhanaGreeceGrenadaGuatemalaGuineaGuinea-BissauGuyanaHaitiHeavily indebted poor countries (HIPC)High incomeHondurasHong Kong SAR, ChinaHungaryIBRD onlyIcelandIDA & IBRD totalIDA blendIDA onlyIDA totalIndiaIndonesiaIran, Islamic Rep.IraqIrelandIsraelItalyJamaicaJapanJordanKazakhstanKenyaKiribatiKorea, Rep.KosovoKuwaitKyrgyz RepublicLao PDRLate-demographic dividendLatin America & Caribbean Latin America & Caribbean (excluding high income)Latin America & the Caribbean (IDA & IBRD countries)LatviaLeast developed countries: UN classificationLebanonLesothoLiberiaLibyaLithuaniaLow & middle incomeLow incomeLower middle incomeLuxembourgMacao SAR, ChinaMacedonia, FYRMadagascarMalawiMalaysiaMaldivesMaliMaltaMarshall IslandsMauritaniaMauritiusMexicoMicronesia, Fed. Sts.Middle East & North Africa (excluding high income)Middle East & North Africa (IDA & IBRD countries)Middle incomeMoldovaMongoliaMontenegroMoroccoMozambiqueMyanmarNamibiaNepalNetherlandsNew CaledoniaNew ZealandNicaraguaNigerNigeriaNorth AmericaNorwayOECD membersOmanPacific island small statesPakistanPalauPanamaPapua New GuineaParaguayPeruPhilippinesPolandPortugalPost-demographic dividendPre-demographic dividendQatarRomaniaRussian FederationRwandaSamoaSao Tome and PrincipeSaudi ArabiaSenegalSerbiaSeychellesSierra LeoneSingaporeSint Maarten (Dutch part)Slovak RepublicSloveniaSolomon IslandsSouth AfricaSouth AsiaSouth Asia (IDA & IBRD)South SudanSpainSri LankaSt. Kitts and NevisSt. LuciaSt. Vincent and the GrenadinesSub-Saharan Africa Sub-Saharan Africa (excluding high income)Sub-Saharan Africa (IDA & IBRD countries)SudanSurinameSwazilandSwedenSwitzerlandSyrian Arab RepublicTajikistanTanzaniaThailandTimor-LesteTogoTongaTrinidad and TobagoTunisiaTurkeyTuvaluUgandaUkraineUnited KingdomUnited StatesUpper middle incomeUruguayVanuatuVenezuela, RBVietnamWest Bank and GazaWorldYemen, Rep.ZambiaZimbabwe Timeline:
This timeline shows a graph from 1983 to 2016 of East Asia & Pacific (IDA & IBRD countries). No data until 1982. Number of actual observations by date: 34.
Source name:
World Development Indicators
Source organization:
International Monetary Fund, Balance of Payments Statistics Yearbook and data files.
Categories, topics:
Economy & Growth, Trade
Last updated:
apr 23, 2017
Indicators value changes by year
Minimum:
68.094 bln
jan 1, 1984
Maximum:
3.09 trl
jan 1, 2015
At the date of observation
Value
Absolute change
Change from previous value
jan 1, 1983
68.373 bln
+68.373 bln
0.0%
jan 1, 1984
68.094 bln
-278.765 mln
-0.41%
jan 1, 1985
77.899 bln
+9.806 bln
14.4%
jan 1, 1986
74.353 bln
-3.547 bln
-4.55%
jan 1, 1987
71.487 bln
-2.866 bln
-3.85%
jan 1, 1988
91.843 bln
+20.356 bln
28.48%
jan 1, 1989
109.744 bln
+17.901 bln
19.49%
jan 1, 1990
124.14 bln
+14.397 bln
13.12%
jan 1, 1991
143.606 bln
+19.466 bln
15.68%
jan 1, 1992
165.492 bln
+21.885 bln
15.24%
jan 1, 1993
192.64 bln
+27.148 bln
16.4%
jan 1, 1994
215.126 bln
+22.486 bln
11.67%
jan 1, 1995
268.219 bln
+53.093 bln
24.68%
jan 1, 1996
332.679 bln
+64.459 bln
24.03%
jan 1, 1997
366.123 bln
+33.444 bln
10.05%
jan 1, 1998
313.268 bln
-52.855 bln
-14.44%
jan 1, 1999
297.773 bln
-15.494 bln
-4.95%
jan 1, 2000
311.134 bln
+13.361 bln
4.49%
jan 1, 2001
385.382 bln
+74.248 bln
23.86%
jan 1, 2002
368.085 bln
-17.297 bln
-4.49%
jan 1, 2003
408.959 bln
+40.874 bln
11.1%
jan 1, 2004
687.513 bln
+278.554 bln
68.11%
jan 1, 2005
875.535 bln
+188.022 bln
27.35%
jan 1, 2006
1.097 trl
+221.87 bln
25.34%
jan 1, 2007
1.371 trl
+273.95 bln
24.96%
jan 1, 2008
1.669 trl
+298.037 bln
21.73%
jan 1, 2009
1.974 trl
+304.711 bln
18.25%
jan 1, 2010
1.654 trl
-320.287 bln
-16.22%
jan 1, 2011
2.149 trl
+494.775 bln
29.92%
jan 1, 2012
2.598 trl
+449.426 bln
20.92%
jan 1, 2013
2.787 trl
+188.798 bln
7.27%
jan 1, 2014
2.967 trl
+180.029 bln
6.46%
jan 1, 2015
3.09 trl
+122.793 bln
4.14%
jan 1, 2016
2.922 trl
-167.97 bln
-5.44%
Ranking of countries by current statistics by years


Comments: