29
/
en
AIzaSyAYiBZKx7MnpbEhh9jyipgxe19OcubqV5w
April 1, 2024
277707
Uruguay
URY
true
2
1
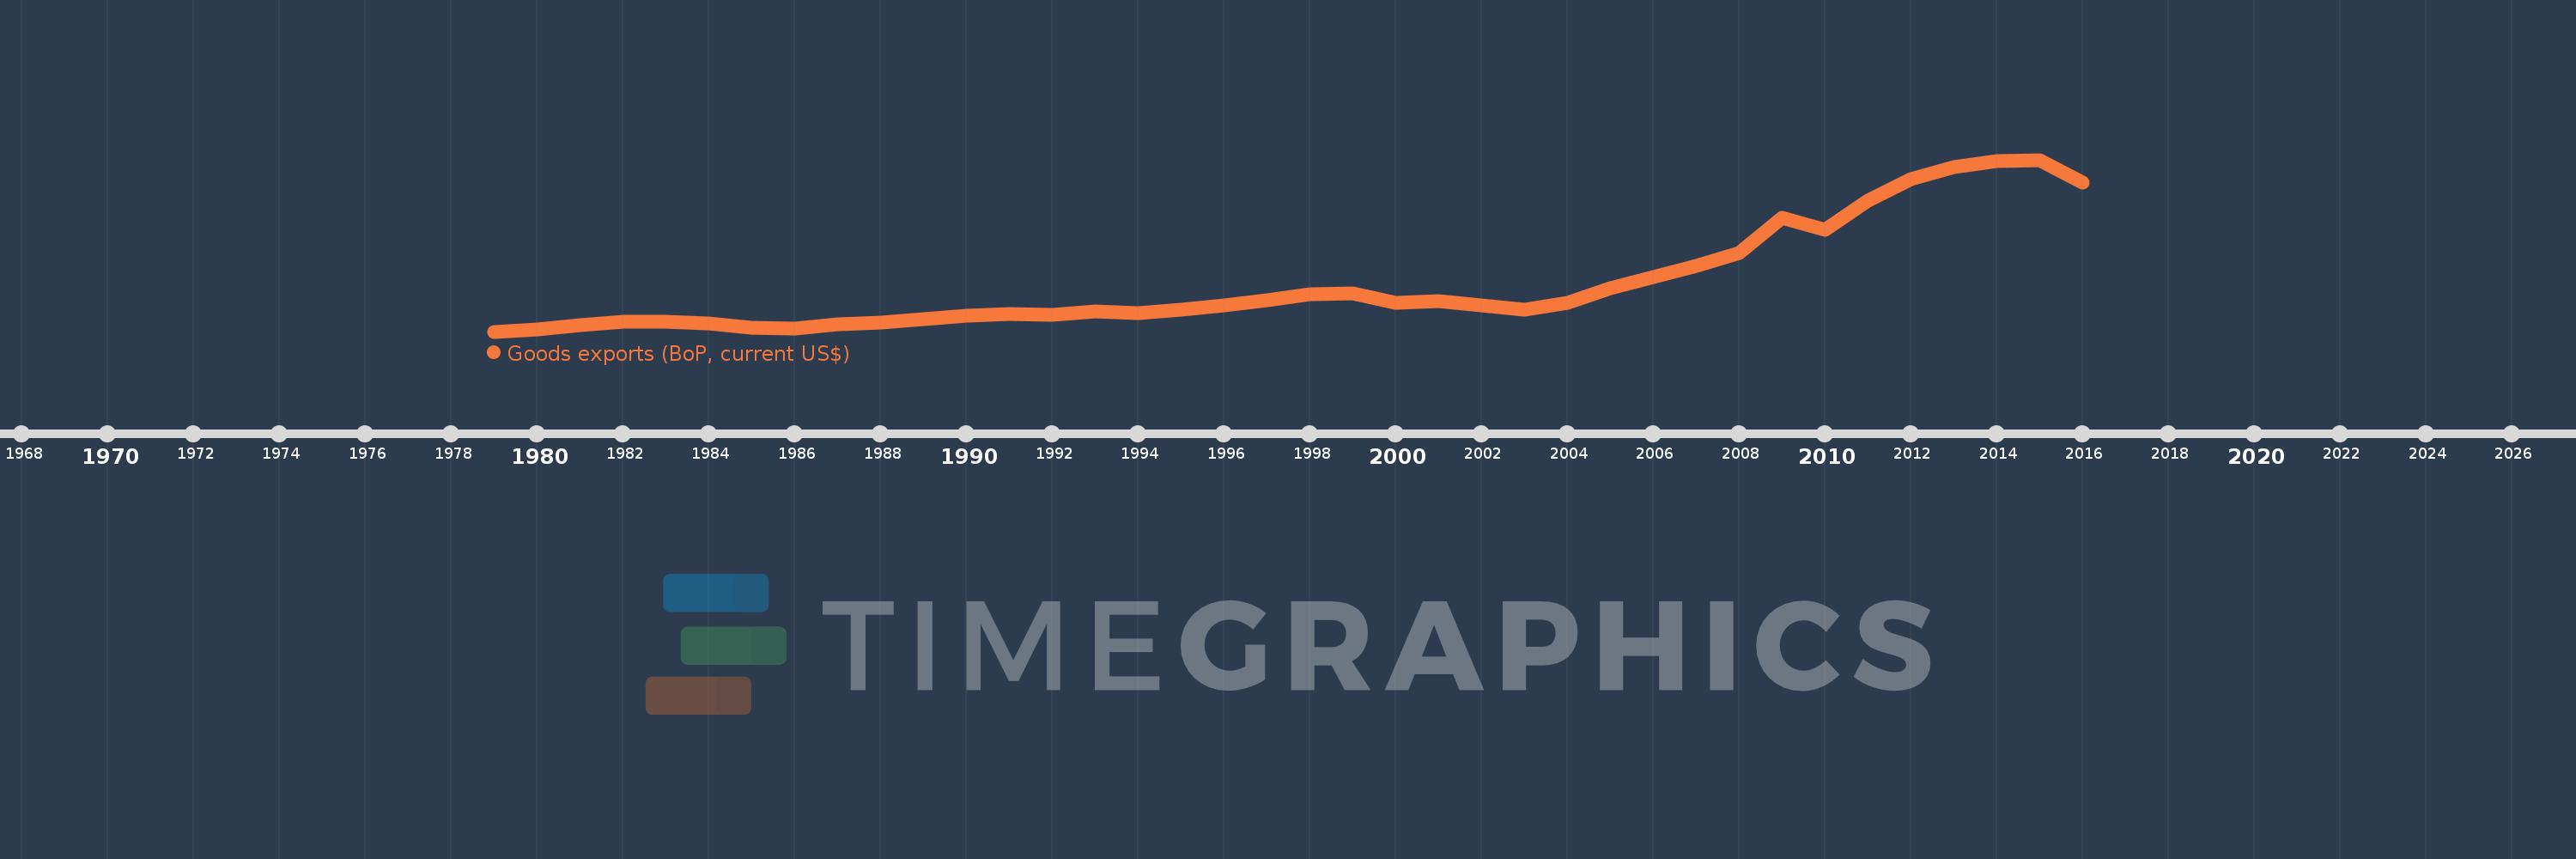
Goods exports (BoP, current US$)
2016,2015,2014,2013,2012,2011,2010,2009,2008,2007,2006,2005,2004,2003,2002,2001,2000,1999,1998,1997,1996,1995,1994,1993,1992,1991,1990,1989,1988,1987,1986,1985,1984,1983,1982,1981,1980,1979
This statistics in other country:
AfghanistanAlbaniaAlgeriaAngolaAntigua and BarbudaArab WorldArgentinaArmeniaArubaAustraliaAustriaAzerbaijanBahamas, TheBahrainBangladeshBarbadosBelarusBelgiumBelizeBeninBermudaBhutanBoliviaBosnia and HerzegovinaBotswanaBrazilBrunei DarussalamBulgariaBurkina FasoBurundiCabo VerdeCambodiaCameroonCanadaCaribbean small statesCentral African RepublicCentral Europe and the BalticsChadChileChinaColombiaComorosCongo, Dem. Rep.Congo, Rep.Costa RicaCote d'IvoireCroatiaCuracaoCyprusCzech RepublicDenmarkDjiboutiDominicaDominican RepublicEarly-demographic dividendEast Asia & PacificEast Asia & Pacific (excluding high income)East Asia & Pacific (IDA & IBRD countries)EcuadorEgypt, Arab Rep.El SalvadorEquatorial GuineaEritreaEstoniaEthiopiaEuro areaEurope & Central AsiaEurope & Central Asia (excluding high income)Europe & Central Asia (IDA & IBRD countries)European UnionFaroe IslandsFijiFinlandFragile and conflict affected situationsFranceFrench PolynesiaGabonGambia, TheGeorgiaGermanyGhanaGreeceGrenadaGuatemalaGuineaGuinea-BissauGuyanaHaitiHeavily indebted poor countries (HIPC)High incomeHondurasHong Kong SAR, ChinaHungaryIBRD onlyIcelandIDA & IBRD totalIDA blendIDA onlyIDA totalIndiaIndonesiaIran, Islamic Rep.IraqIrelandIsraelItalyJamaicaJapanJordanKazakhstanKenyaKiribatiKorea, Rep.KosovoKuwaitKyrgyz RepublicLao PDRLate-demographic dividendLatin America & Caribbean Latin America & Caribbean (excluding high income)Latin America & the Caribbean (IDA & IBRD countries)LatviaLeast developed countries: UN classificationLebanonLesothoLiberiaLibyaLithuaniaLow & middle incomeLow incomeLower middle incomeLuxembourgMacao SAR, ChinaMacedonia, FYRMadagascarMalawiMalaysiaMaldivesMaliMaltaMarshall IslandsMauritaniaMauritiusMexicoMicronesia, Fed. Sts.Middle East & North Africa (excluding high income)Middle East & North Africa (IDA & IBRD countries)Middle incomeMoldovaMongoliaMontenegroMoroccoMozambiqueMyanmarNamibiaNepalNetherlandsNew CaledoniaNew ZealandNicaraguaNigerNigeriaNorth AmericaNorwayOECD membersOmanPacific island small statesPakistanPalauPanamaPapua New GuineaParaguayPeruPhilippinesPolandPortugalPost-demographic dividendPre-demographic dividendQatarRomaniaRussian FederationRwandaSamoaSao Tome and PrincipeSaudi ArabiaSenegalSerbiaSeychellesSierra LeoneSingaporeSint Maarten (Dutch part)Slovak RepublicSloveniaSolomon IslandsSouth AfricaSouth AsiaSouth Asia (IDA & IBRD)South SudanSpainSri LankaSt. Kitts and NevisSt. LuciaSt. Vincent and the GrenadinesSub-Saharan Africa Sub-Saharan Africa (excluding high income)Sub-Saharan Africa (IDA & IBRD countries)SudanSurinameSwazilandSwedenSwitzerlandSyrian Arab RepublicTajikistanTanzaniaThailandTimor-LesteTogoTongaTrinidad and TobagoTunisiaTurkeyTuvaluUgandaUkraineUnited KingdomUnited StatesUpper middle incomeUruguayVanuatuVenezuela, RBVietnamWest Bank and GazaWorldYemen, Rep.ZambiaZimbabwe Timeline:
This timeline shows a graph from 1979 to 2016 of Uruguay. No data until 1978. Number of actual observations by date: 38.
Source name:
World Development Indicators
Source organization:
International Monetary Fund, Balance of Payments Statistics Yearbook and data files.
Categories, topics:
Economy & Growth, Trade
Last updated:
apr 23, 2017
Indicators value changes by year
Minimum:
686.1 mln
jan 1, 1979
Maximum:
10.343 bln
jan 1, 2015
At the date of observation
Value
Absolute change
Change from previous value
jan 1, 1979
686.1 mln
+686.1 mln
0.0%
jan 1, 1980
788.1 mln
+102.0 mln
14.87%
jan 1, 1981
1.058 bln
+270.4 mln
34.31%
jan 1, 1982
1.23 bln
+171.2 mln
16.17%
jan 1, 1983
1.256 bln
+26.7 mln
2.17%
jan 1, 1984
1.156 bln
-100.0 mln
-7.96%
jan 1, 1985
924.6 mln
-231.8 mln
-20.04%
jan 1, 1986
853.6 mln
-71.0 mln
-7.68%
jan 1, 1987
1.088 bln
+234.2 mln
27.44%
jan 1, 1988
1.182 bln
+94.5 mln
8.69%
jan 1, 1989
1.405 bln
+222.2 mln
18.79%
jan 1, 1990
1.599 bln
+194.5 mln
13.85%
jan 1, 1991
1.693 bln
+93.9 mln
5.87%
jan 1, 1992
1.605 bln
-88.2 mln
-5.21%
jan 1, 1993
1.801 bln
+196.7 mln
12.26%
jan 1, 1994
1.732 bln
-69.8 mln
-3.87%
jan 1, 1995
1.918 bln
+186.0 mln
10.74%
jan 1, 1996
2.148 bln
+230.0 mln
11.99%
jan 1, 1997
2.449 bln
+300.9 mln
14.01%
jan 1, 1998
2.793 bln
+344.6 mln
14.07%
jan 1, 1999
2.829 bln
+36.2 mln
1.3%
jan 1, 2000
2.291 bln
-538.7 mln
-19.04%
jan 1, 2001
2.384 bln
+93.185 mln
4.07%
jan 1, 2002
2.139 bln
-244.29 mln
-10.25%
jan 1, 2003
1.922 bln
-217.429 mln
-10.16%
jan 1, 2004
2.281 bln
+359.125 mln
18.68%
jan 1, 2005
3.145 bln
+863.816 mln
37.87%
jan 1, 2006
3.774 bln
+629.071 mln
20.0%
jan 1, 2007
4.4 bln
+625.732 mln
16.58%
jan 1, 2008
5.1 bln
+700.095 mln
15.91%
jan 1, 2009
7.095 bln
+1.996 bln
39.13%
jan 1, 2010
6.392 bln
-703.64 mln
-9.92%
jan 1, 2011
8.031 bln
+1.639 bln
25.64%
jan 1, 2012
9.274 bln
+1.243 bln
15.48%
jan 1, 2013
9.916 bln
+642.01 mln
6.92%
jan 1, 2014
10.257 bln
+341.106 mln
3.44%
jan 1, 2015
10.343 bln
+86.024 mln
0.84%
jan 1, 2016
9.077 bln
-1.266 bln
-12.24%
Ranking of countries by current statistics by years


Comments: