29
/
en
AIzaSyAYiBZKx7MnpbEhh9jyipgxe19OcubqV5w
April 1, 2024
152564
Hungary
HUN
true
2
1
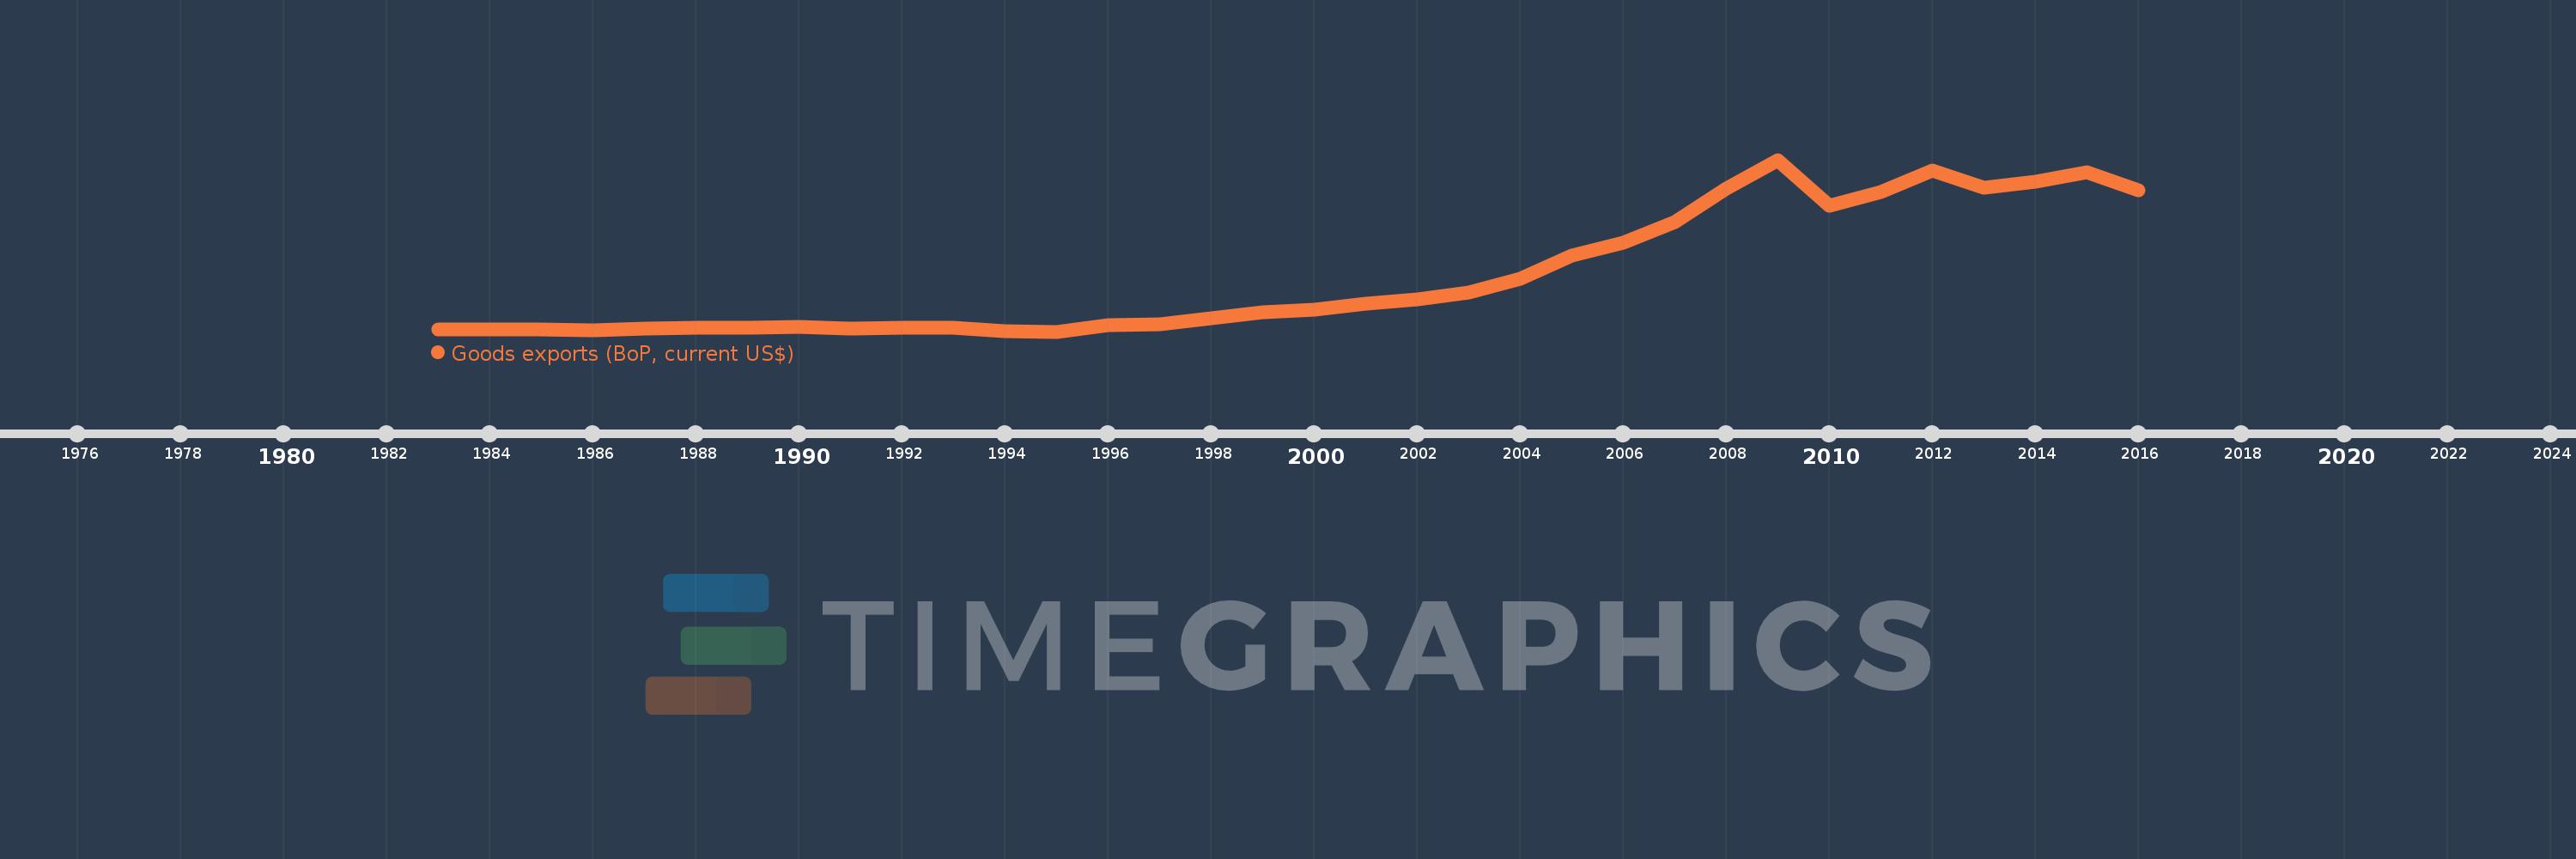
Goods exports (BoP, current US$)
2016,2015,2014,2013,2012,2011,2010,2009,2008,2007,2006,2005,2004,2003,2002,2001,2000,1999,1998,1997,1996,1995,1994,1993,1992,1991,1990,1989,1988,1987,1986,1985,1984,1983
This statistics in other country:
AfghanistanAlbaniaAlgeriaAngolaAntigua and BarbudaArab WorldArgentinaArmeniaArubaAustraliaAustriaAzerbaijanBahamas, TheBahrainBangladeshBarbadosBelarusBelgiumBelizeBeninBermudaBhutanBoliviaBosnia and HerzegovinaBotswanaBrazilBrunei DarussalamBulgariaBurkina FasoBurundiCabo VerdeCambodiaCameroonCanadaCaribbean small statesCentral African RepublicCentral Europe and the BalticsChadChileChinaColombiaComorosCongo, Dem. Rep.Congo, Rep.Costa RicaCote d'IvoireCroatiaCuracaoCyprusCzech RepublicDenmarkDjiboutiDominicaDominican RepublicEarly-demographic dividendEast Asia & PacificEast Asia & Pacific (excluding high income)East Asia & Pacific (IDA & IBRD countries)EcuadorEgypt, Arab Rep.El SalvadorEquatorial GuineaEritreaEstoniaEthiopiaEuro areaEurope & Central AsiaEurope & Central Asia (excluding high income)Europe & Central Asia (IDA & IBRD countries)European UnionFaroe IslandsFijiFinlandFragile and conflict affected situationsFranceFrench PolynesiaGabonGambia, TheGeorgiaGermanyGhanaGreeceGrenadaGuatemalaGuineaGuinea-BissauGuyanaHaitiHeavily indebted poor countries (HIPC)High incomeHondurasHong Kong SAR, ChinaHungaryIBRD onlyIcelandIDA & IBRD totalIDA blendIDA onlyIDA totalIndiaIndonesiaIran, Islamic Rep.IraqIrelandIsraelItalyJamaicaJapanJordanKazakhstanKenyaKiribatiKorea, Rep.KosovoKuwaitKyrgyz RepublicLao PDRLate-demographic dividendLatin America & Caribbean Latin America & Caribbean (excluding high income)Latin America & the Caribbean (IDA & IBRD countries)LatviaLeast developed countries: UN classificationLebanonLesothoLiberiaLibyaLithuaniaLow & middle incomeLow incomeLower middle incomeLuxembourgMacao SAR, ChinaMacedonia, FYRMadagascarMalawiMalaysiaMaldivesMaliMaltaMarshall IslandsMauritaniaMauritiusMexicoMicronesia, Fed. Sts.Middle East & North Africa (excluding high income)Middle East & North Africa (IDA & IBRD countries)Middle incomeMoldovaMongoliaMontenegroMoroccoMozambiqueMyanmarNamibiaNepalNetherlandsNew CaledoniaNew ZealandNicaraguaNigerNigeriaNorth AmericaNorwayOECD membersOmanPacific island small statesPakistanPalauPanamaPapua New GuineaParaguayPeruPhilippinesPolandPortugalPost-demographic dividendPre-demographic dividendQatarRomaniaRussian FederationRwandaSamoaSao Tome and PrincipeSaudi ArabiaSenegalSerbiaSeychellesSierra LeoneSingaporeSint Maarten (Dutch part)Slovak RepublicSloveniaSolomon IslandsSouth AfricaSouth AsiaSouth Asia (IDA & IBRD)South SudanSpainSri LankaSt. Kitts and NevisSt. LuciaSt. Vincent and the GrenadinesSub-Saharan Africa Sub-Saharan Africa (excluding high income)Sub-Saharan Africa (IDA & IBRD countries)SudanSurinameSwazilandSwedenSwitzerlandSyrian Arab RepublicTajikistanTanzaniaThailandTimor-LesteTogoTongaTrinidad and TobagoTunisiaTurkeyTuvaluUgandaUkraineUnited KingdomUnited StatesUpper middle incomeUruguayVanuatuVenezuela, RBVietnamWest Bank and GazaWorldYemen, Rep.ZambiaZimbabwe Timeline:
This timeline shows a graph from 1983 to 2016 of Hungary. No data until 1982. Number of actual observations by date: 34.
Source name:
World Development Indicators
Source organization:
International Monetary Fund, Balance of Payments Statistics Yearbook and data files.
Categories, topics:
Economy & Growth, Trade
Last updated:
apr 23, 2017
Indicators value changes by year
Minimum:
7.648 bln
jan 1, 1995
Maximum:
105.858 bln
jan 1, 2009
At the date of observation
Value
Absolute change
Change from previous value
jan 1, 1983
9.038 bln
+9.038 bln
0.0%
jan 1, 1984
8.978 bln
-60.149 mln
-0.67%
jan 1, 1985
9.09 bln
+112.002 mln
1.25%
jan 1, 1986
8.578 bln
-512.029 mln
-5.63%
jan 1, 1987
9.198 bln
+620.04 mln
7.23%
jan 1, 1988
9.967 bln
+769.123 mln
8.36%
jan 1, 1989
9.989 bln
+21.851 mln
0.22%
jan 1, 1990
10.493 bln
+503.997 mln
5.05%
jan 1, 1991
9.151 bln
-1.342 bln
-12.79%
jan 1, 1992
9.688 bln
+536.269 mln
5.86%
jan 1, 1993
10.097 bln
+409.075 mln
4.22%
jan 1, 1994
8.119 bln
-1.978 bln
-19.59%
jan 1, 1995
7.648 bln
-470.515 mln
-5.8%
jan 1, 1996
11.322 bln
+3.674 bln
48.04%
jan 1, 1997
11.945 bln
+623.095 mln
5.5%
jan 1, 1998
15.077 bln
+3.131 bln
26.21%
jan 1, 1999
18.457 bln
+3.38 bln
22.42%
jan 1, 2000
20.371 bln
+1.914 bln
10.37%
jan 1, 2001
23.74 bln
+3.369 bln
16.54%
jan 1, 2002
25.968 bln
+2.228 bln
9.39%
jan 1, 2003
30.123 bln
+4.155 bln
16.0%
jan 1, 2004
37.655 bln
+7.533 bln
25.01%
jan 1, 2005
50.961 bln
+13.305 bln
35.33%
jan 1, 2006
58.646 bln
+7.685 bln
15.08%
jan 1, 2007
70.188 bln
+11.542 bln
19.68%
jan 1, 2008
89.603 bln
+19.416 bln
27.66%
jan 1, 2009
105.858 bln
+16.255 bln
18.14%
jan 1, 2010
79.38 bln
-26.478 bln
-25.01%
jan 1, 2011
87.666 bln
+8.286 bln
10.44%
jan 1, 2012
99.911 bln
+12.245 bln
13.97%
jan 1, 2013
89.883 bln
-10.027 bln
-10.04%
jan 1, 2014
93.299 bln
+3.415 bln
3.8%
jan 1, 2015
98.845 bln
+5.546 bln
5.94%
jan 1, 2016
88.284 bln
-10.56 bln
-10.68%
Ranking of countries by current statistics by years


Comments: