29
/
en
AIzaSyAYiBZKx7MnpbEhh9jyipgxe19OcubqV5w
April 1, 2024
156022
Indonesia
IDN
true
2
1
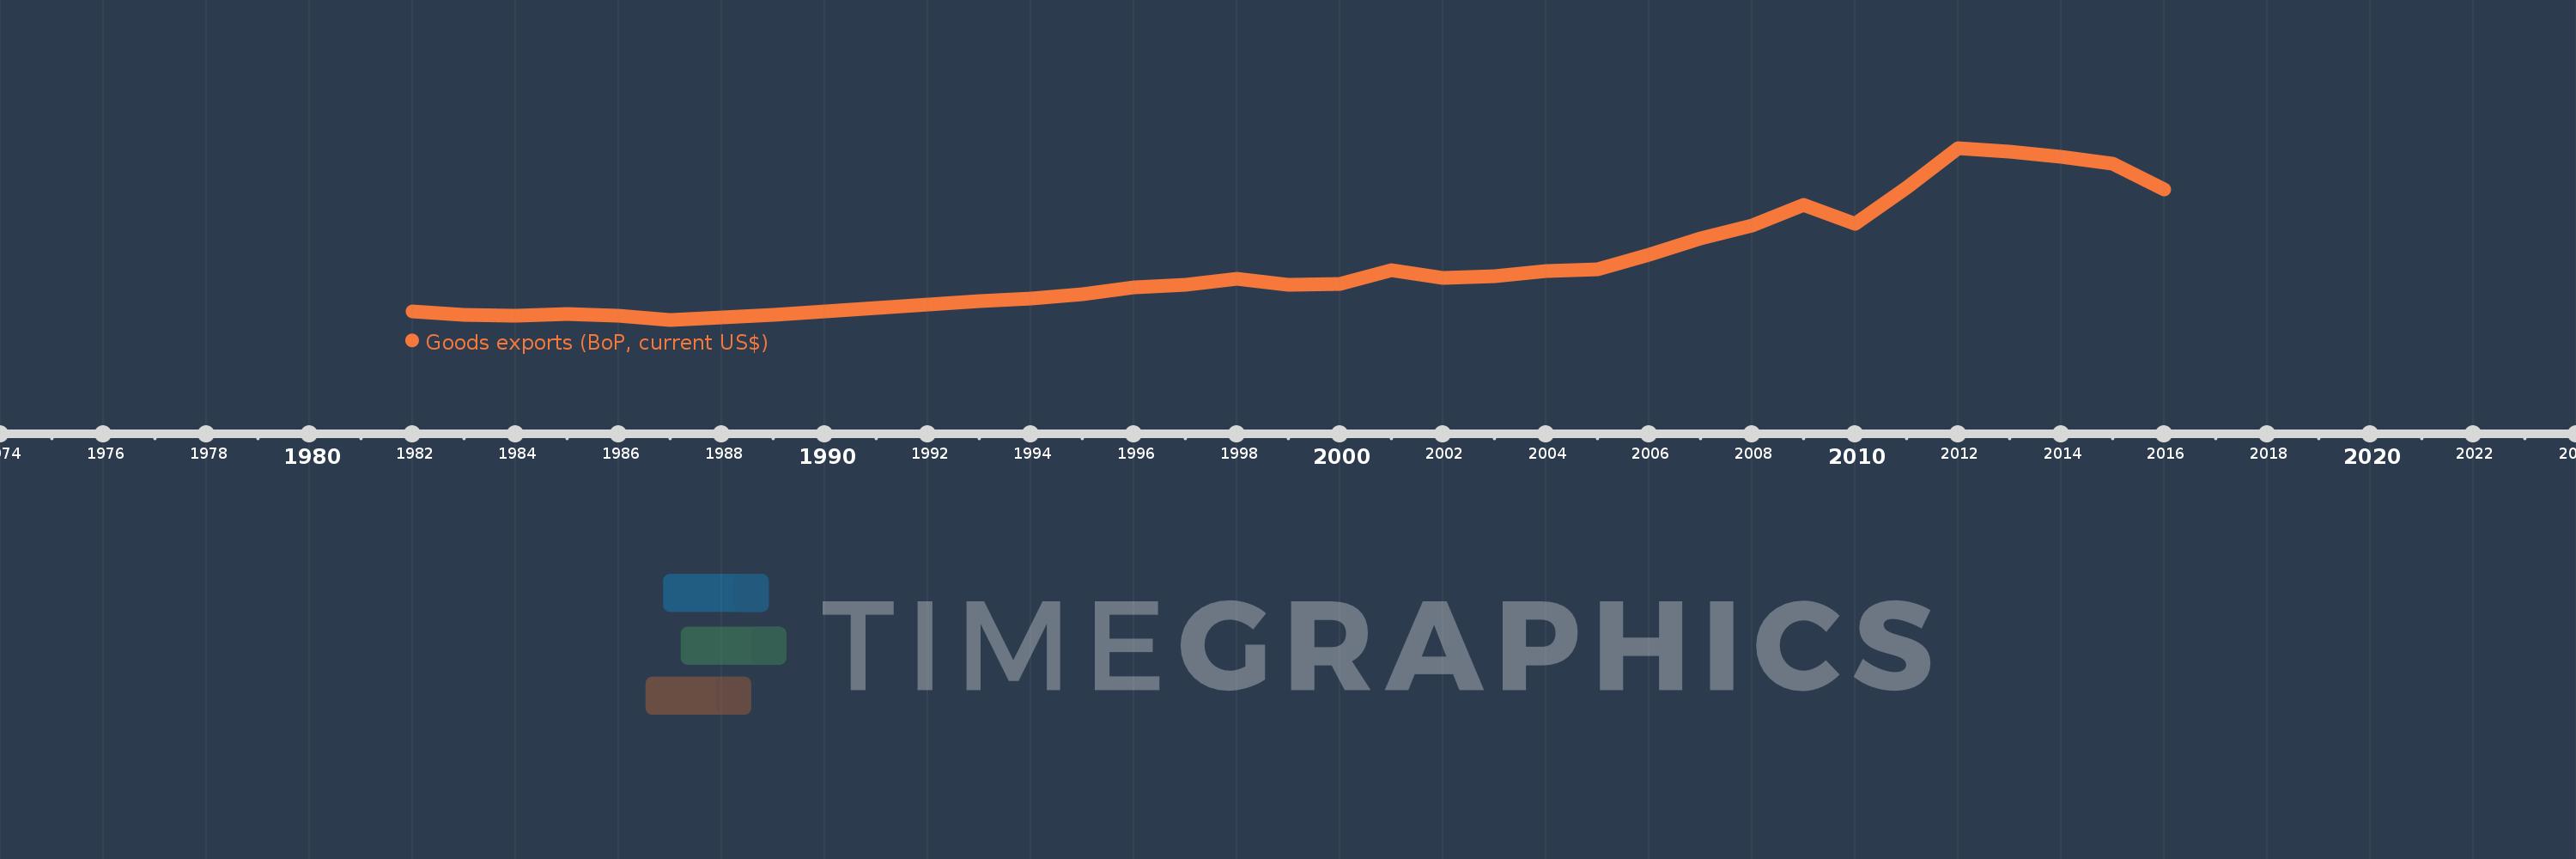
Goods exports (BoP, current US$)
2016,2015,2014,2013,2012,2011,2010,2009,2008,2007,2006,2005,2004,2003,2002,2001,2000,1999,1998,1997,1996,1995,1994,1993,1992,1991,1990,1989,1988,1987,1986,1985,1984,1983,1982
This statistics in other country:
AfghanistanAlbaniaAlgeriaAngolaAntigua and BarbudaArab WorldArgentinaArmeniaArubaAustraliaAustriaAzerbaijanBahamas, TheBahrainBangladeshBarbadosBelarusBelgiumBelizeBeninBermudaBhutanBoliviaBosnia and HerzegovinaBotswanaBrazilBrunei DarussalamBulgariaBurkina FasoBurundiCabo VerdeCambodiaCameroonCanadaCaribbean small statesCentral African RepublicCentral Europe and the BalticsChadChileChinaColombiaComorosCongo, Dem. Rep.Congo, Rep.Costa RicaCote d'IvoireCroatiaCuracaoCyprusCzech RepublicDenmarkDjiboutiDominicaDominican RepublicEarly-demographic dividendEast Asia & PacificEast Asia & Pacific (excluding high income)East Asia & Pacific (IDA & IBRD countries)EcuadorEgypt, Arab Rep.El SalvadorEquatorial GuineaEritreaEstoniaEthiopiaEuro areaEurope & Central AsiaEurope & Central Asia (excluding high income)Europe & Central Asia (IDA & IBRD countries)European UnionFaroe IslandsFijiFinlandFragile and conflict affected situationsFranceFrench PolynesiaGabonGambia, TheGeorgiaGermanyGhanaGreeceGrenadaGuatemalaGuineaGuinea-BissauGuyanaHaitiHeavily indebted poor countries (HIPC)High incomeHondurasHong Kong SAR, ChinaHungaryIBRD onlyIcelandIDA & IBRD totalIDA blendIDA onlyIDA totalIndiaIndonesiaIran, Islamic Rep.IraqIrelandIsraelItalyJamaicaJapanJordanKazakhstanKenyaKiribatiKorea, Rep.KosovoKuwaitKyrgyz RepublicLao PDRLate-demographic dividendLatin America & Caribbean Latin America & Caribbean (excluding high income)Latin America & the Caribbean (IDA & IBRD countries)LatviaLeast developed countries: UN classificationLebanonLesothoLiberiaLibyaLithuaniaLow & middle incomeLow incomeLower middle incomeLuxembourgMacao SAR, ChinaMacedonia, FYRMadagascarMalawiMalaysiaMaldivesMaliMaltaMarshall IslandsMauritaniaMauritiusMexicoMicronesia, Fed. Sts.Middle East & North Africa (excluding high income)Middle East & North Africa (IDA & IBRD countries)Middle incomeMoldovaMongoliaMontenegroMoroccoMozambiqueMyanmarNamibiaNepalNetherlandsNew CaledoniaNew ZealandNicaraguaNigerNigeriaNorth AmericaNorwayOECD membersOmanPacific island small statesPakistanPalauPanamaPapua New GuineaParaguayPeruPhilippinesPolandPortugalPost-demographic dividendPre-demographic dividendQatarRomaniaRussian FederationRwandaSamoaSao Tome and PrincipeSaudi ArabiaSenegalSerbiaSeychellesSierra LeoneSingaporeSint Maarten (Dutch part)Slovak RepublicSloveniaSolomon IslandsSouth AfricaSouth AsiaSouth Asia (IDA & IBRD)South SudanSpainSri LankaSt. Kitts and NevisSt. LuciaSt. Vincent and the GrenadinesSub-Saharan Africa Sub-Saharan Africa (excluding high income)Sub-Saharan Africa (IDA & IBRD countries)SudanSurinameSwazilandSwedenSwitzerlandSyrian Arab RepublicTajikistanTanzaniaThailandTimor-LesteTogoTongaTrinidad and TobagoTunisiaTurkeyTuvaluUgandaUkraineUnited KingdomUnited StatesUpper middle incomeUruguayVanuatuVenezuela, RBVietnamWest Bank and GazaWorldYemen, Rep.ZambiaZimbabwe Timeline:
This timeline shows a graph from 1982 to 2016 of Indonesia. No data until 1981. Number of actual observations by date: 35.
Source name:
World Development Indicators
Source organization:
International Monetary Fund, Balance of Payments Statistics Yearbook and data files.
Categories, topics:
Economy & Growth, Trade
Last updated:
apr 23, 2017
Indicators value changes by year
Minimum:
14.396 bln
jan 1, 1987
Maximum:
191.109 bln
jan 1, 2012
At the date of observation
Value
Absolute change
Change from previous value
jan 1, 1982
23.348 bln
+23.348 bln
0.0%
jan 1, 1983
19.747 bln
-3.601 bln
-15.42%
jan 1, 1984
18.689 bln
-1.058 bln
-5.36%
jan 1, 1985
20.754 bln
+2.065 bln
11.05%
jan 1, 1986
18.527 bln
-2.227 bln
-10.73%
jan 1, 1987
14.396 bln
-4.131 bln
-22.3%
jan 1, 1988
17.206 bln
+2.81 bln
19.52%
jan 1, 1989
19.509 bln
+2.303 bln
13.38%
jan 1, 1990
22.974 bln
+3.465 bln
17.76%
jan 1, 1991
26.807 bln
+3.833 bln
16.68%
jan 1, 1992
29.635 bln
+2.828 bln
10.55%
jan 1, 1993
33.796 bln
+4.161 bln
14.04%
jan 1, 1994
36.607 bln
+2.811 bln
8.32%
jan 1, 1995
40.223 bln
+3.616 bln
9.88%
jan 1, 1996
47.454 bln
+7.231 bln
17.98%
jan 1, 1997
50.188 bln
+2.734 bln
5.76%
jan 1, 1998
56.298 bln
+6.11 bln
12.17%
jan 1, 1999
50.371 bln
-5.927 bln
-10.53%
jan 1, 2000
51.242 bln
+870.916 mln
1.73%
jan 1, 2001
65.407 bln
+14.165 bln
27.64%
jan 1, 2002
57.365 bln
-8.043 bln
-12.3%
jan 1, 2003
59.165 bln
+1.801 bln
3.14%
jan 1, 2004
64.109 bln
+4.944 bln
8.36%
jan 1, 2005
66.084 bln
+1.975 bln
3.08%
jan 1, 2006
81.682 bln
+15.598 bln
23.6%
jan 1, 2007
98.251 bln
+16.569 bln
20.28%
jan 1, 2008
111.301 bln
+13.05 bln
13.28%
jan 1, 2009
132.21 bln
+20.909 bln
18.79%
jan 1, 2010
113.266 bln
-18.943 bln
-14.33%
jan 1, 2011
149.966 bln
+36.699 bln
32.4%
jan 1, 2012
191.109 bln
+41.143 bln
27.43%
jan 1, 2013
187.347 bln
-3.762 bln
-1.97%
jan 1, 2014
182.089 bln
-5.257 bln
-2.81%
jan 1, 2015
175.293 bln
-6.796 bln
-3.73%
jan 1, 2016
148.365 bln
-26.928 bln
-15.36%
Ranking of countries by current statistics by years


Comments: