29
/
en
AIzaSyAYiBZKx7MnpbEhh9jyipgxe19OcubqV5w
April 1, 2024
104906
Chile
CHL
true
2
1
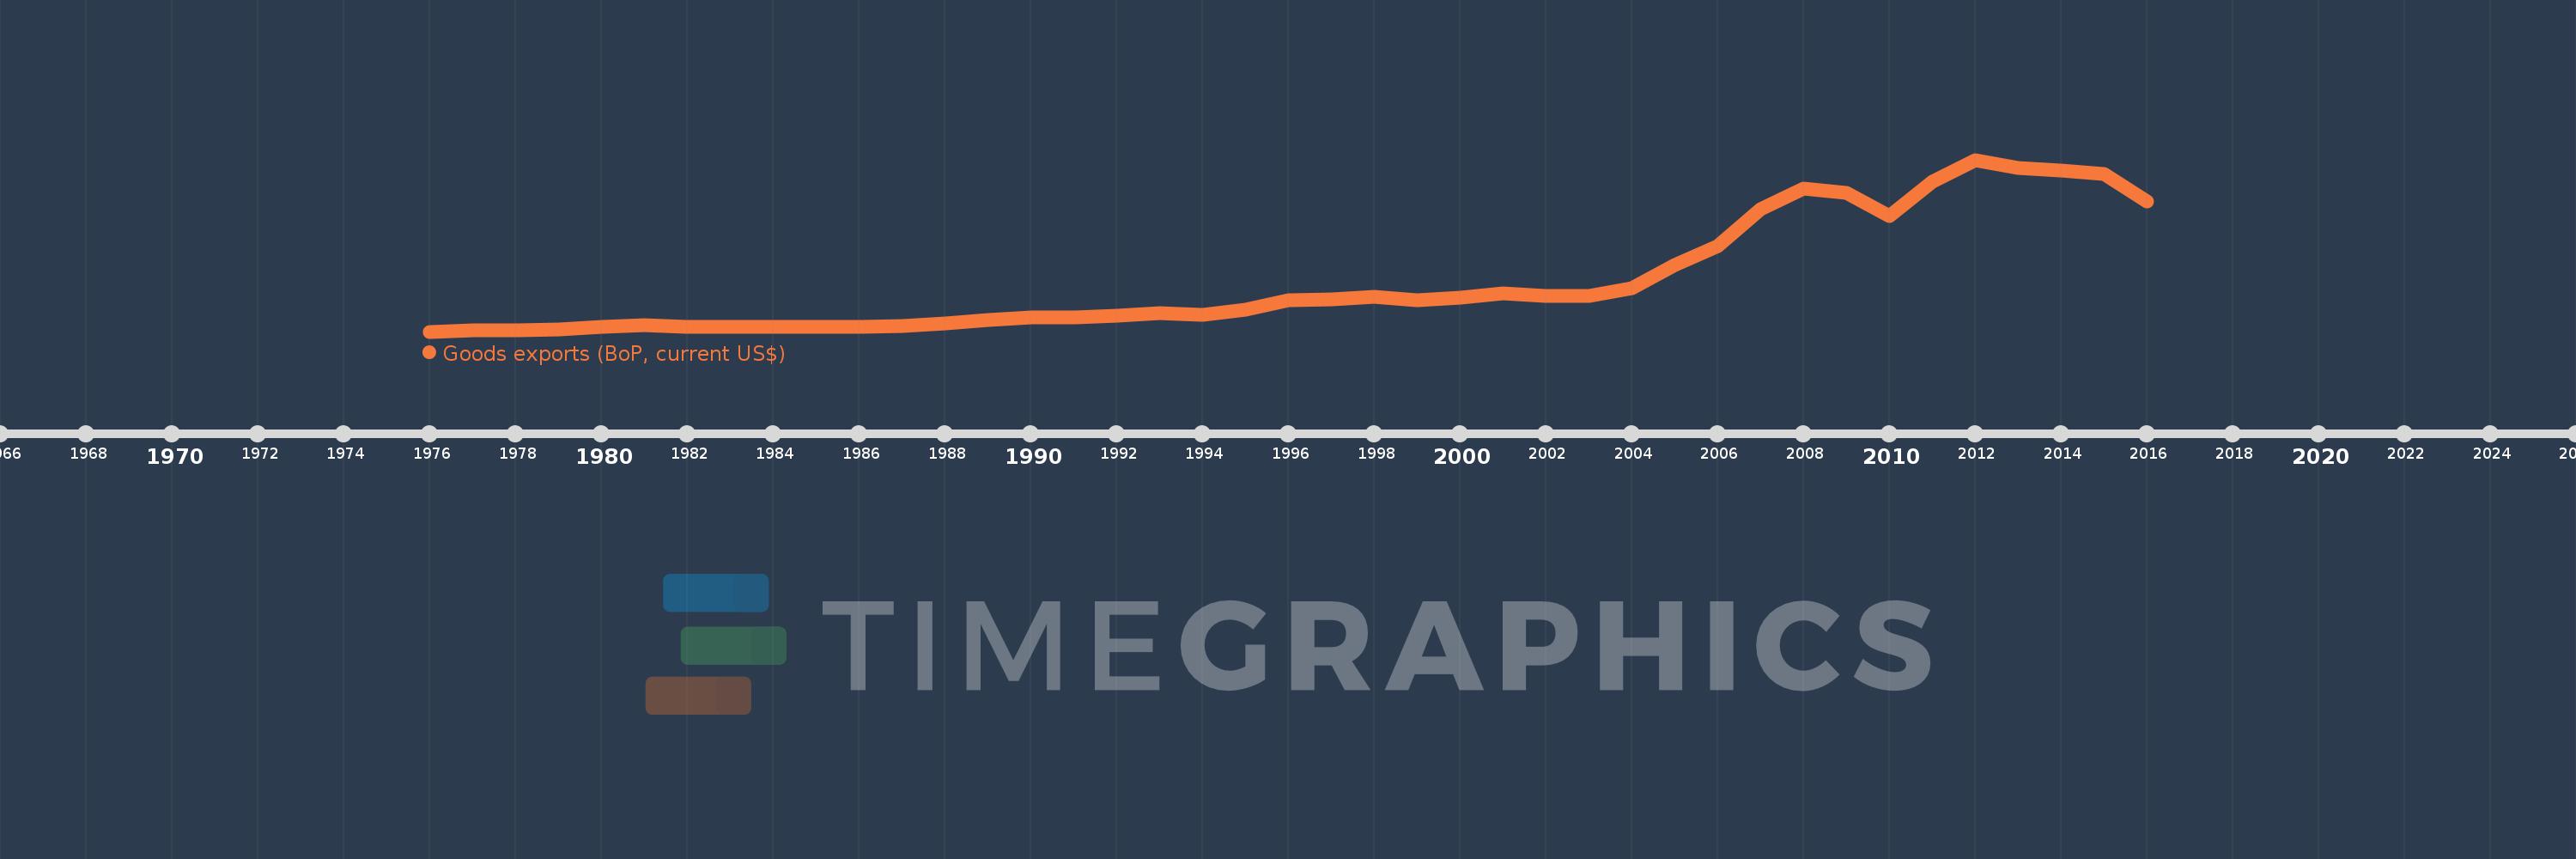
Goods exports (BoP, current US$)
2016,2015,2014,2013,2012,2011,2010,2009,2008,2007,2006,2005,2004,2003,2002,2001,2000,1999,1998,1997,1996,1995,1994,1993,1992,1991,1990,1989,1988,1987,1986,1985,1984,1983,1982,1981,1980,1979,1978,1977,1976
This statistics in other country:
AfghanistanAlbaniaAlgeriaAngolaAntigua and BarbudaArab WorldArgentinaArmeniaArubaAustraliaAustriaAzerbaijanBahamas, TheBahrainBangladeshBarbadosBelarusBelgiumBelizeBeninBermudaBhutanBoliviaBosnia and HerzegovinaBotswanaBrazilBrunei DarussalamBulgariaBurkina FasoBurundiCabo VerdeCambodiaCameroonCanadaCaribbean small statesCentral African RepublicCentral Europe and the BalticsChadChileChinaColombiaComorosCongo, Dem. Rep.Congo, Rep.Costa RicaCote d'IvoireCroatiaCuracaoCyprusCzech RepublicDenmarkDjiboutiDominicaDominican RepublicEarly-demographic dividendEast Asia & PacificEast Asia & Pacific (excluding high income)East Asia & Pacific (IDA & IBRD countries)EcuadorEgypt, Arab Rep.El SalvadorEquatorial GuineaEritreaEstoniaEthiopiaEuro areaEurope & Central AsiaEurope & Central Asia (excluding high income)Europe & Central Asia (IDA & IBRD countries)European UnionFaroe IslandsFijiFinlandFragile and conflict affected situationsFranceFrench PolynesiaGabonGambia, TheGeorgiaGermanyGhanaGreeceGrenadaGuatemalaGuineaGuinea-BissauGuyanaHaitiHeavily indebted poor countries (HIPC)High incomeHondurasHong Kong SAR, ChinaHungaryIBRD onlyIcelandIDA & IBRD totalIDA blendIDA onlyIDA totalIndiaIndonesiaIran, Islamic Rep.IraqIrelandIsraelItalyJamaicaJapanJordanKazakhstanKenyaKiribatiKorea, Rep.KosovoKuwaitKyrgyz RepublicLao PDRLate-demographic dividendLatin America & Caribbean Latin America & Caribbean (excluding high income)Latin America & the Caribbean (IDA & IBRD countries)LatviaLeast developed countries: UN classificationLebanonLesothoLiberiaLibyaLithuaniaLow & middle incomeLow incomeLower middle incomeLuxembourgMacao SAR, ChinaMacedonia, FYRMadagascarMalawiMalaysiaMaldivesMaliMaltaMarshall IslandsMauritaniaMauritiusMexicoMicronesia, Fed. Sts.Middle East & North Africa (excluding high income)Middle East & North Africa (IDA & IBRD countries)Middle incomeMoldovaMongoliaMontenegroMoroccoMozambiqueMyanmarNamibiaNepalNetherlandsNew CaledoniaNew ZealandNicaraguaNigerNigeriaNorth AmericaNorwayOECD membersOmanPacific island small statesPakistanPalauPanamaPapua New GuineaParaguayPeruPhilippinesPolandPortugalPost-demographic dividendPre-demographic dividendQatarRomaniaRussian FederationRwandaSamoaSao Tome and PrincipeSaudi ArabiaSenegalSerbiaSeychellesSierra LeoneSingaporeSint Maarten (Dutch part)Slovak RepublicSloveniaSolomon IslandsSouth AfricaSouth AsiaSouth Asia (IDA & IBRD)South SudanSpainSri LankaSt. Kitts and NevisSt. LuciaSt. Vincent and the GrenadinesSub-Saharan Africa Sub-Saharan Africa (excluding high income)Sub-Saharan Africa (IDA & IBRD countries)SudanSurinameSwazilandSwedenSwitzerlandSyrian Arab RepublicTajikistanTanzaniaThailandTimor-LesteTogoTongaTrinidad and TobagoTunisiaTurkeyTuvaluUgandaUkraineUnited KingdomUnited StatesUpper middle incomeUruguayVanuatuVenezuela, RBVietnamWest Bank and GazaWorldYemen, Rep.ZambiaZimbabwe Timeline:
This timeline shows a graph from 1976 to 2016 of Chile. No data until 1975. Number of actual observations by date: 41.
Source name:
World Development Indicators
Source organization:
International Monetary Fund, Balance of Payments Statistics Yearbook and data files.
Categories, topics:
Economy & Growth, Trade
Last updated:
apr 23, 2017
Indicators value changes by year
Minimum:
1.59 bln
jan 1, 1976
Maximum:
81.438 bln
jan 1, 2012
At the date of observation
Value
Absolute change
Change from previous value
jan 1, 1976
1.59 bln
+1.59 bln
0.0%
jan 1, 1977
2.116 bln
+526.0 mln
33.08%
jan 1, 1978
2.186 bln
+70.0 mln
3.31%
jan 1, 1979
2.46 bln
+274.0 mln
12.53%
jan 1, 1980
3.835 bln
+1.375 bln
55.89%
jan 1, 1981
4.705 bln
+870.0 mln
22.69%
jan 1, 1982
3.836 bln
-869.0 mln
-18.47%
jan 1, 1983
3.706 bln
-130.0 mln
-3.39%
jan 1, 1984
3.831 bln
+125.0 mln
3.37%
jan 1, 1985
3.65 bln
-181.0 mln
-4.72%
jan 1, 1986
3.804 bln
+154.1 mln
4.22%
jan 1, 1987
4.191 bln
+387.1 mln
10.18%
jan 1, 1988
5.303 bln
+1.112 bln
26.53%
jan 1, 1989
7.054 bln
+1.751 bln
33.02%
jan 1, 1990
8.078 bln
+1.024 bln
14.52%
jan 1, 1991
8.373 bln
+294.3 mln
3.64%
jan 1, 1992
8.941 bln
+568.8 mln
6.79%
jan 1, 1993
10.007 bln
+1.066 bln
11.92%
jan 1, 1994
9.199 bln
-808.7 mln
-8.08%
jan 1, 1995
11.604 bln
+2.405 bln
26.15%
jan 1, 1996
16.025 bln
+4.421 bln
38.1%
jan 1, 1997
16.626 bln
+601.466 mln
3.75%
jan 1, 1998
17.87 bln
+1.243 bln
7.48%
jan 1, 1999
16.323 bln
-1.547 bln
-8.66%
jan 1, 2000
17.162 bln
+839.422 mln
5.14%
jan 1, 2001
19.21 bln
+2.048 bln
11.93%
jan 1, 2002
18.271 bln
-938.496 mln
-4.89%
jan 1, 2003
18.178 bln
-93.253 mln
-0.51%
jan 1, 2004
21.663 bln
+3.485 bln
19.17%
jan 1, 2005
32.52 bln
+10.857 bln
50.12%
jan 1, 2006
41.266 bln
+8.746 bln
26.9%
jan 1, 2007
58.678 bln
+17.412 bln
42.19%
jan 1, 2008
67.971 bln
+9.293 bln
15.84%
jan 1, 2009
66.258 bln
-1.713 bln
-2.52%
jan 1, 2010
55.463 bln
-10.796 bln
-16.29%
jan 1, 2011
71.109 bln
+15.646 bln
28.21%
jan 1, 2012
81.438 bln
+10.329 bln
14.53%
jan 1, 2013
77.791 bln
-3.647 bln
-4.48%
jan 1, 2014
76.386 bln
-1.404 bln
-1.81%
jan 1, 2015
74.924 bln
-1.462 bln
-1.91%
jan 1, 2016
62.232 bln
-12.692 bln
-16.94%
Ranking of countries by current statistics by years


Comments: