29
/
en
AIzaSyAYiBZKx7MnpbEhh9jyipgxe19OcubqV5w
April 1, 2024
44275
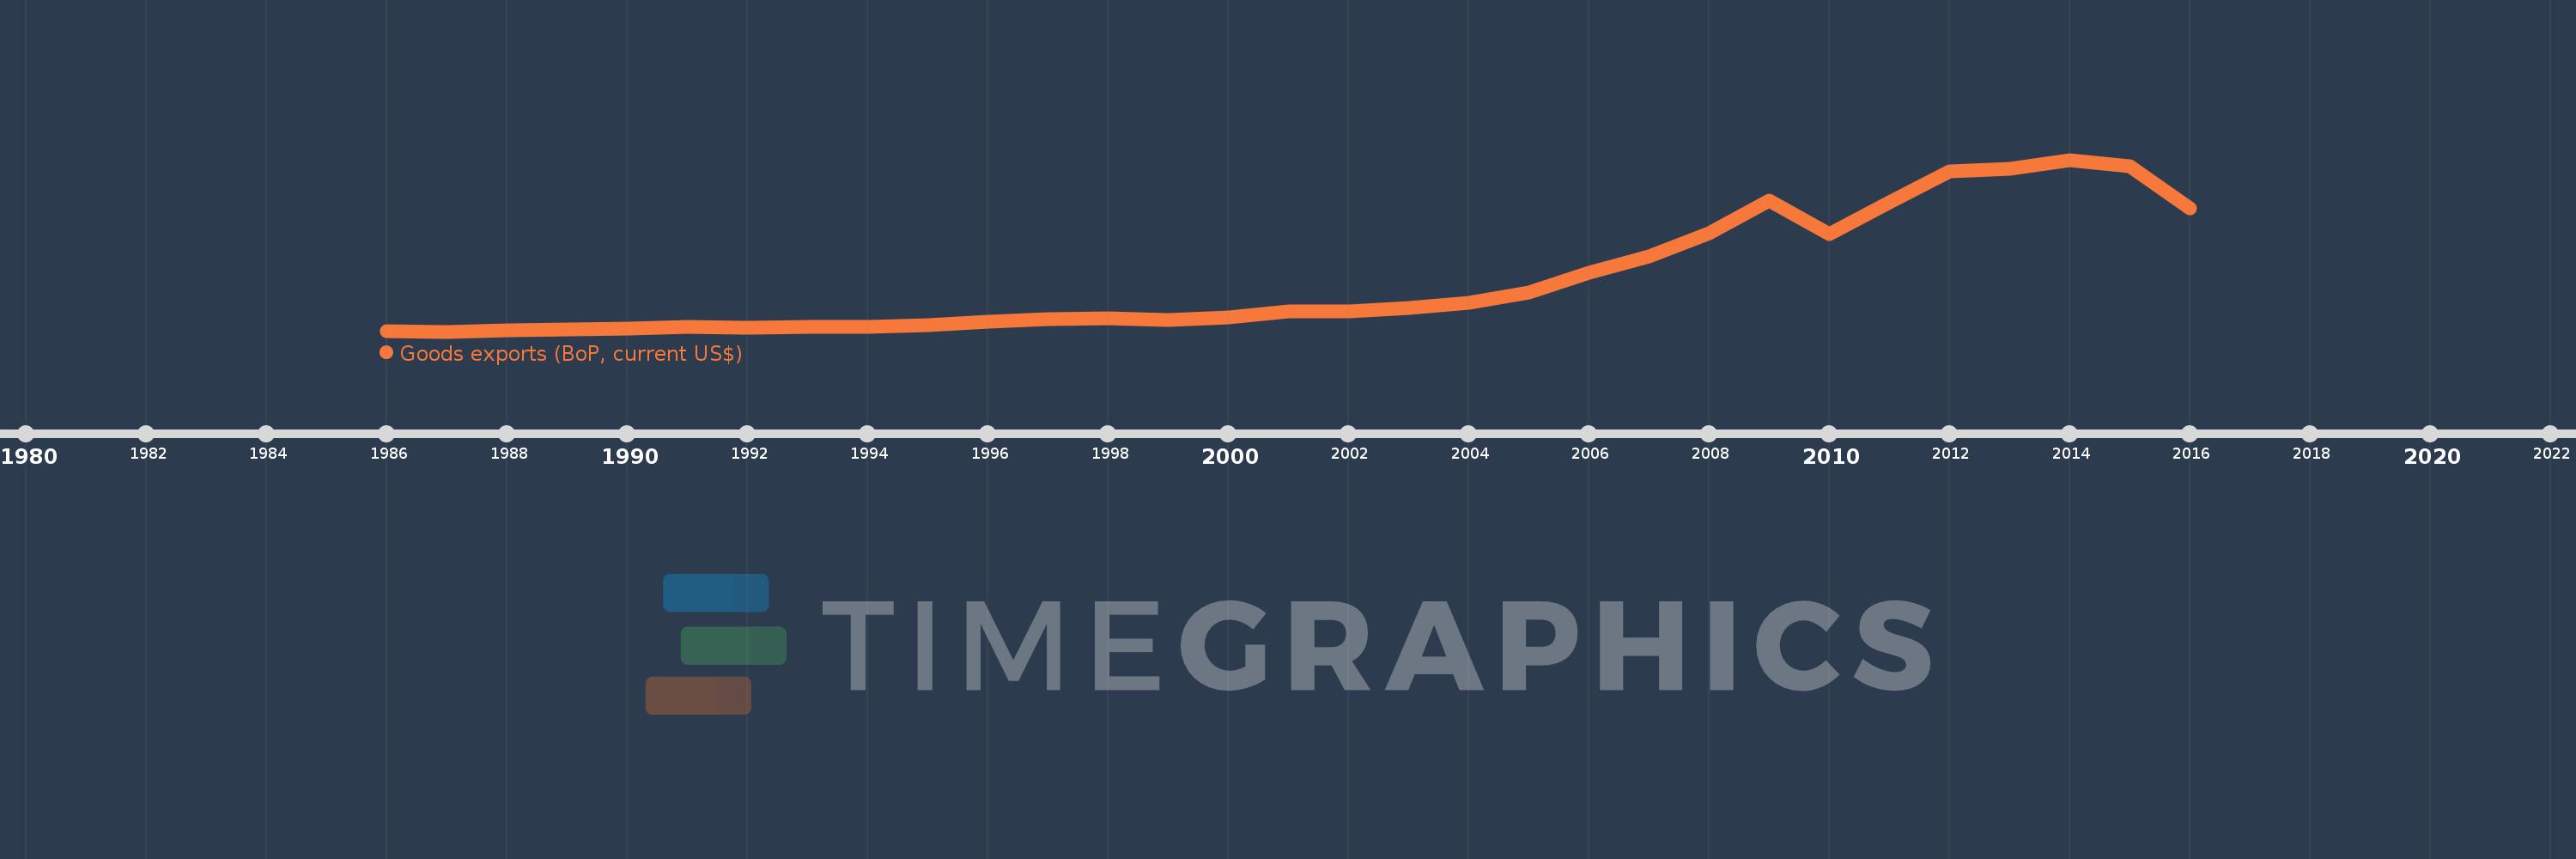
Least developed countries: UN classification
LDC
false
2
1
Goods exports (BoP, current US$)
2016,2015,2014,2013,2012,2011,2010,2009,2008,2007,2006,2005,2004,2003,2002,2001,2000,1999,1998,1997,1996,1995,1994,1993,1992,1991,1990,1989,1988,1987,1986
This statistics in other country:
AfghanistanAlbaniaAlgeriaAngolaAntigua and BarbudaArab WorldArgentinaArmeniaArubaAustraliaAustriaAzerbaijanBahamas, TheBahrainBangladeshBarbadosBelarusBelgiumBelizeBeninBermudaBhutanBoliviaBosnia and HerzegovinaBotswanaBrazilBrunei DarussalamBulgariaBurkina FasoBurundiCabo VerdeCambodiaCameroonCanadaCaribbean small statesCentral African RepublicCentral Europe and the BalticsChadChileChinaColombiaComorosCongo, Dem. Rep.Congo, Rep.Costa RicaCote d'IvoireCroatiaCuracaoCyprusCzech RepublicDenmarkDjiboutiDominicaDominican RepublicEarly-demographic dividendEast Asia & PacificEast Asia & Pacific (excluding high income)East Asia & Pacific (IDA & IBRD countries)EcuadorEgypt, Arab Rep.El SalvadorEquatorial GuineaEritreaEstoniaEthiopiaEuro areaEurope & Central AsiaEurope & Central Asia (excluding high income)Europe & Central Asia (IDA & IBRD countries)European UnionFaroe IslandsFijiFinlandFragile and conflict affected situationsFranceFrench PolynesiaGabonGambia, TheGeorgiaGermanyGhanaGreeceGrenadaGuatemalaGuineaGuinea-BissauGuyanaHaitiHeavily indebted poor countries (HIPC)High incomeHondurasHong Kong SAR, ChinaHungaryIBRD onlyIcelandIDA & IBRD totalIDA blendIDA onlyIDA totalIndiaIndonesiaIran, Islamic Rep.IraqIrelandIsraelItalyJamaicaJapanJordanKazakhstanKenyaKiribatiKorea, Rep.KosovoKuwaitKyrgyz RepublicLao PDRLate-demographic dividendLatin America & Caribbean Latin America & Caribbean (excluding high income)Latin America & the Caribbean (IDA & IBRD countries)LatviaLeast developed countries: UN classificationLebanonLesothoLiberiaLibyaLithuaniaLow & middle incomeLow incomeLower middle incomeLuxembourgMacao SAR, ChinaMacedonia, FYRMadagascarMalawiMalaysiaMaldivesMaliMaltaMarshall IslandsMauritaniaMauritiusMexicoMicronesia, Fed. Sts.Middle East & North Africa (excluding high income)Middle East & North Africa (IDA & IBRD countries)Middle incomeMoldovaMongoliaMontenegroMoroccoMozambiqueMyanmarNamibiaNepalNetherlandsNew CaledoniaNew ZealandNicaraguaNigerNigeriaNorth AmericaNorwayOECD membersOmanPacific island small statesPakistanPalauPanamaPapua New GuineaParaguayPeruPhilippinesPolandPortugalPost-demographic dividendPre-demographic dividendQatarRomaniaRussian FederationRwandaSamoaSao Tome and PrincipeSaudi ArabiaSenegalSerbiaSeychellesSierra LeoneSingaporeSint Maarten (Dutch part)Slovak RepublicSloveniaSolomon IslandsSouth AfricaSouth AsiaSouth Asia (IDA & IBRD)South SudanSpainSri LankaSt. Kitts and NevisSt. LuciaSt. Vincent and the GrenadinesSub-Saharan Africa Sub-Saharan Africa (excluding high income)Sub-Saharan Africa (IDA & IBRD countries)SudanSurinameSwazilandSwedenSwitzerlandSyrian Arab RepublicTajikistanTanzaniaThailandTimor-LesteTogoTongaTrinidad and TobagoTunisiaTurkeyTuvaluUgandaUkraineUnited KingdomUnited StatesUpper middle incomeUruguayVanuatuVenezuela, RBVietnamWest Bank and GazaWorldYemen, Rep.ZambiaZimbabwe Timeline:
This timeline shows a graph from 1986 to 2016 of Least developed countries: UN classification. No data until 1985. Number of actual observations by date: 31.
Source name:
World Development Indicators
Source organization:
International Monetary Fund, Balance of Payments Statistics Yearbook and data files.
Categories, topics:
Economy & Growth, Trade
Last updated:
apr 23, 2017
Indicators value changes by year
Minimum:
12.88 bln
jan 1, 1987
Maximum:
225.603 bln
jan 1, 2014
At the date of observation
Value
Absolute change
Change from previous value
jan 1, 1986
13.875 bln
+13.875 bln
0.0%
jan 1, 1987
12.88 bln
-995.076 mln
-7.17%
jan 1, 1988
14.584 bln
+1.703 bln
13.22%
jan 1, 1989
15.481 bln
+897.098 mln
6.15%
jan 1, 1990
16.558 bln
+1.077 bln
6.96%
jan 1, 1991
18.655 bln
+2.097 bln
12.67%
jan 1, 1992
17.791 bln
-863.411 mln
-4.63%
jan 1, 1993
18.734 bln
+942.505 mln
5.3%
jan 1, 1994
18.25 bln
-484.328 mln
-2.59%
jan 1, 1995
20.776 bln
+2.527 bln
13.85%
jan 1, 1996
25.169 bln
+4.393 bln
21.14%
jan 1, 1997
28.134 bln
+2.965 bln
11.78%
jan 1, 1998
29.241 bln
+1.106 bln
3.93%
jan 1, 1999
27.405 bln
-1.835 bln
-6.28%
jan 1, 2000
30.605 bln
+3.2 bln
11.68%
jan 1, 2001
38.118 bln
+7.513 bln
24.55%
jan 1, 2002
38.074 bln
-44.204 mln
-0.12%
jan 1, 2003
41.689 bln
+3.615 bln
9.49%
jan 1, 2004
48.175 bln
+6.486 bln
15.56%
jan 1, 2005
61.465 bln
+13.291 bln
27.59%
jan 1, 2006
85.283 bln
+23.818 bln
38.75%
jan 1, 2007
105.964 bln
+20.681 bln
24.25%
jan 1, 2008
134.573 bln
+28.609 bln
27.0%
jan 1, 2009
175.322 bln
+40.749 bln
30.28%
jan 1, 2010
133.958 bln
-41.364 bln
-23.59%
jan 1, 2011
172.751 bln
+38.792 bln
28.96%
jan 1, 2012
211.39 bln
+38.639 bln
22.37%
jan 1, 2013
214.765 bln
+3.375 bln
1.6%
jan 1, 2014
225.603 bln
+10.839 bln
5.05%
jan 1, 2015
217.507 bln
-8.096 bln
-3.59%
jan 1, 2016
165.432 bln
-52.076 bln
-23.94%
Ranking of countries by current statistics by years


Comments: