29
/
en
AIzaSyAYiBZKx7MnpbEhh9jyipgxe19OcubqV5w
April 1, 2024
177708
Lesotho
LSO
true
2
1
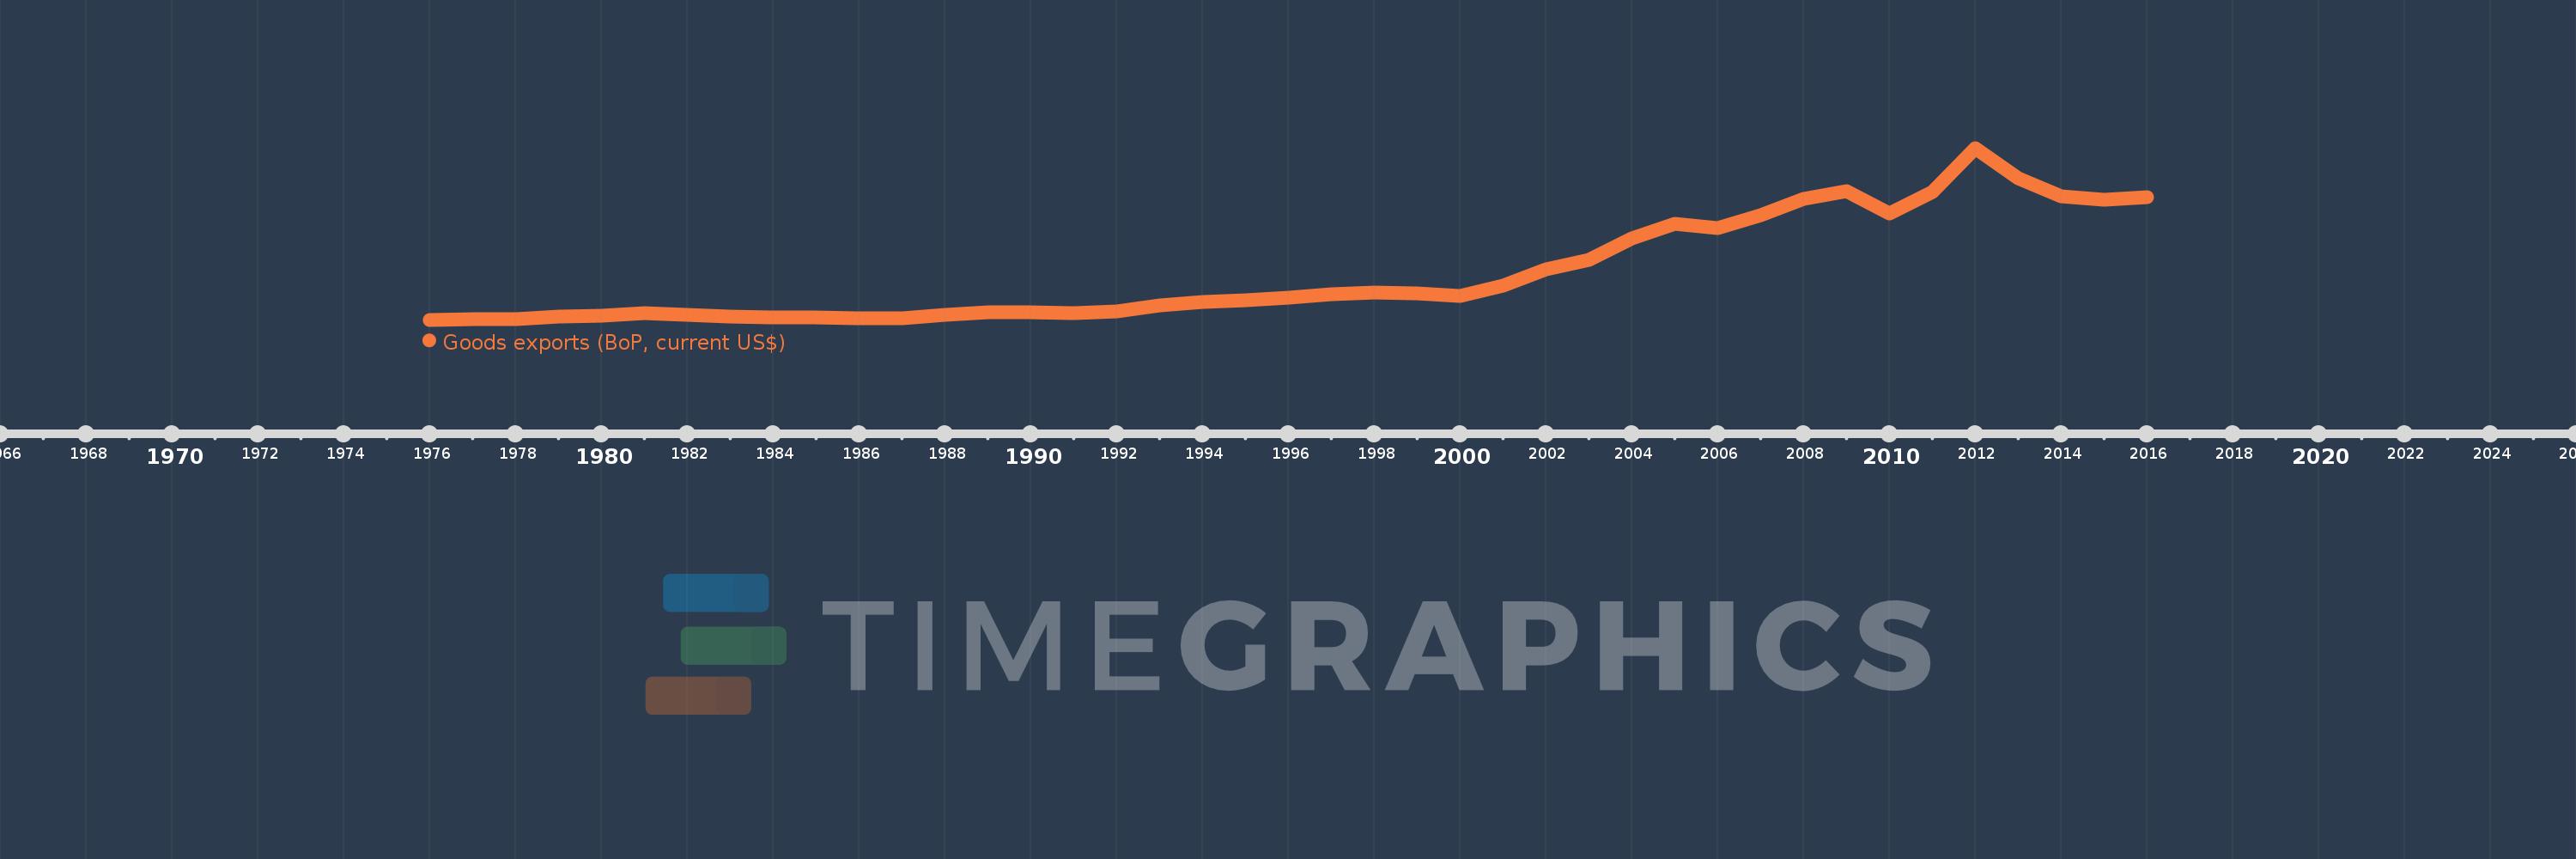
Goods exports (BoP, current US$)
2016,2015,2014,2013,2012,2011,2010,2009,2008,2007,2006,2005,2004,2003,2002,2001,2000,1999,1998,1997,1996,1995,1994,1993,1992,1991,1990,1989,1988,1987,1986,1985,1984,1983,1982,1981,1980,1979,1978,1977,1976
This statistics in other country:
AfghanistanAlbaniaAlgeriaAngolaAntigua and BarbudaArab WorldArgentinaArmeniaArubaAustraliaAustriaAzerbaijanBahamas, TheBahrainBangladeshBarbadosBelarusBelgiumBelizeBeninBermudaBhutanBoliviaBosnia and HerzegovinaBotswanaBrazilBrunei DarussalamBulgariaBurkina FasoBurundiCabo VerdeCambodiaCameroonCanadaCaribbean small statesCentral African RepublicCentral Europe and the BalticsChadChileChinaColombiaComorosCongo, Dem. Rep.Congo, Rep.Costa RicaCote d'IvoireCroatiaCuracaoCyprusCzech RepublicDenmarkDjiboutiDominicaDominican RepublicEarly-demographic dividendEast Asia & PacificEast Asia & Pacific (excluding high income)East Asia & Pacific (IDA & IBRD countries)EcuadorEgypt, Arab Rep.El SalvadorEquatorial GuineaEritreaEstoniaEthiopiaEuro areaEurope & Central AsiaEurope & Central Asia (excluding high income)Europe & Central Asia (IDA & IBRD countries)European UnionFaroe IslandsFijiFinlandFragile and conflict affected situationsFranceFrench PolynesiaGabonGambia, TheGeorgiaGermanyGhanaGreeceGrenadaGuatemalaGuineaGuinea-BissauGuyanaHaitiHeavily indebted poor countries (HIPC)High incomeHondurasHong Kong SAR, ChinaHungaryIBRD onlyIcelandIDA & IBRD totalIDA blendIDA onlyIDA totalIndiaIndonesiaIran, Islamic Rep.IraqIrelandIsraelItalyJamaicaJapanJordanKazakhstanKenyaKiribatiKorea, Rep.KosovoKuwaitKyrgyz RepublicLao PDRLate-demographic dividendLatin America & Caribbean Latin America & Caribbean (excluding high income)Latin America & the Caribbean (IDA & IBRD countries)LatviaLeast developed countries: UN classificationLebanonLesothoLiberiaLibyaLithuaniaLow & middle incomeLow incomeLower middle incomeLuxembourgMacao SAR, ChinaMacedonia, FYRMadagascarMalawiMalaysiaMaldivesMaliMaltaMarshall IslandsMauritaniaMauritiusMexicoMicronesia, Fed. Sts.Middle East & North Africa (excluding high income)Middle East & North Africa (IDA & IBRD countries)Middle incomeMoldovaMongoliaMontenegroMoroccoMozambiqueMyanmarNamibiaNepalNetherlandsNew CaledoniaNew ZealandNicaraguaNigerNigeriaNorth AmericaNorwayOECD membersOmanPacific island small statesPakistanPalauPanamaPapua New GuineaParaguayPeruPhilippinesPolandPortugalPost-demographic dividendPre-demographic dividendQatarRomaniaRussian FederationRwandaSamoaSao Tome and PrincipeSaudi ArabiaSenegalSerbiaSeychellesSierra LeoneSingaporeSint Maarten (Dutch part)Slovak RepublicSloveniaSolomon IslandsSouth AfricaSouth AsiaSouth Asia (IDA & IBRD)South SudanSpainSri LankaSt. Kitts and NevisSt. LuciaSt. Vincent and the GrenadinesSub-Saharan Africa Sub-Saharan Africa (excluding high income)Sub-Saharan Africa (IDA & IBRD countries)SudanSurinameSwazilandSwedenSwitzerlandSyrian Arab RepublicTajikistanTanzaniaThailandTimor-LesteTogoTongaTrinidad and TobagoTunisiaTurkeyTuvaluUgandaUkraineUnited KingdomUnited StatesUpper middle incomeUruguayVanuatuVenezuela, RBVietnamWest Bank and GazaWorldYemen, Rep.ZambiaZimbabwe Timeline:
This timeline shows a graph from 1976 to 2016 of Lesotho. No data until 1975. Number of actual observations by date: 41.
Source name:
World Development Indicators
Source organization:
International Monetary Fund, Balance of Payments Statistics Yearbook and data files.
Categories, topics:
Economy & Growth, Trade
Last updated:
apr 23, 2017
Indicators value changes by year
Minimum:
13.523 mln
jan 1, 1976
Maximum:
1.175 bln
jan 1, 2012
At the date of observation
Value
Absolute change
Change from previous value
jan 1, 1976
13.523 mln
+13.523 mln
0.0%
jan 1, 1977
17.94 mln
+4.417 mln
32.67%
jan 1, 1978
15.18 mln
-2.76 mln
-15.38%
jan 1, 1979
33.005 mln
+17.825 mln
117.42%
jan 1, 1980
39.073 mln
+6.068 mln
18.38%
jan 1, 1981
58.164 mln
+19.091 mln
48.86%
jan 1, 1982
45.241 mln
-12.923 mln
-22.22%
jan 1, 1983
37.354 mln
-7.886 mln
-17.43%
jan 1, 1984
31.092 mln
-6.262 mln
-16.76%
jan 1, 1985
28.327 mln
-2.765 mln
-8.89%
jan 1, 1986
22.43 mln
-5.897 mln
-20.82%
jan 1, 1987
25.387 mln
+2.956 mln
13.18%
jan 1, 1988
46.532 mln
+21.145 mln
83.29%
jan 1, 1989
63.687 mln
+17.155 mln
36.87%
jan 1, 1990
66.375 mln
+2.689 mln
4.22%
jan 1, 1991
59.457 mln
-6.919 mln
-10.42%
jan 1, 1992
67.166 mln
+7.709 mln
12.97%
jan 1, 1993
109.245 mln
+42.079 mln
62.65%
jan 1, 1994
133.954 mln
+24.71 mln
22.62%
jan 1, 1995
143.477 mln
+9.523 mln
7.11%
jan 1, 1996
160.023 mln
+16.545 mln
11.53%
jan 1, 1997
186.862 mln
+26.84 mln
16.77%
jan 1, 1998
196.054 mln
+9.191 mln
4.92%
jan 1, 1999
193.427 mln
-2.627 mln
-1.34%
jan 1, 2000
172.505 mln
-20.922 mln
-10.82%
jan 1, 2001
245.034 mln
+72.529 mln
42.04%
jan 1, 2002
356.355 mln
+111.321 mln
45.43%
jan 1, 2003
420.446 mln
+64.09 mln
17.98%
jan 1, 2004
561.093 mln
+140.647 mln
33.45%
jan 1, 2005
664.449 mln
+103.356 mln
18.42%
jan 1, 2006
634.296 mln
-30.153 mln
-4.54%
jan 1, 2007
718.189 mln
+83.893 mln
13.23%
jan 1, 2008
829.703 mln
+111.514 mln
15.53%
jan 1, 2009
884.044 mln
+54.341 mln
6.55%
jan 1, 2010
734.146 mln
-149.899 mln
-16.96%
jan 1, 2011
877.657 mln
+143.511 mln
19.55%
jan 1, 2012
1.175 bln
+297.135 mln
33.86%
jan 1, 2013
972.356 mln
-202.436 mln
-17.23%
jan 1, 2014
847.059 mln
-125.297 mln
-12.89%
jan 1, 2015
826.413 mln
-20.646 mln
-2.44%
jan 1, 2016
844.098 mln
+17.685 mln
2.14%
Ranking of countries by current statistics by years


Comments: