29
/
en
AIzaSyAYiBZKx7MnpbEhh9jyipgxe19OcubqV5w
April 1, 2024
48790
Middle East & North Africa (excluding high income)
MNA
false
2
1
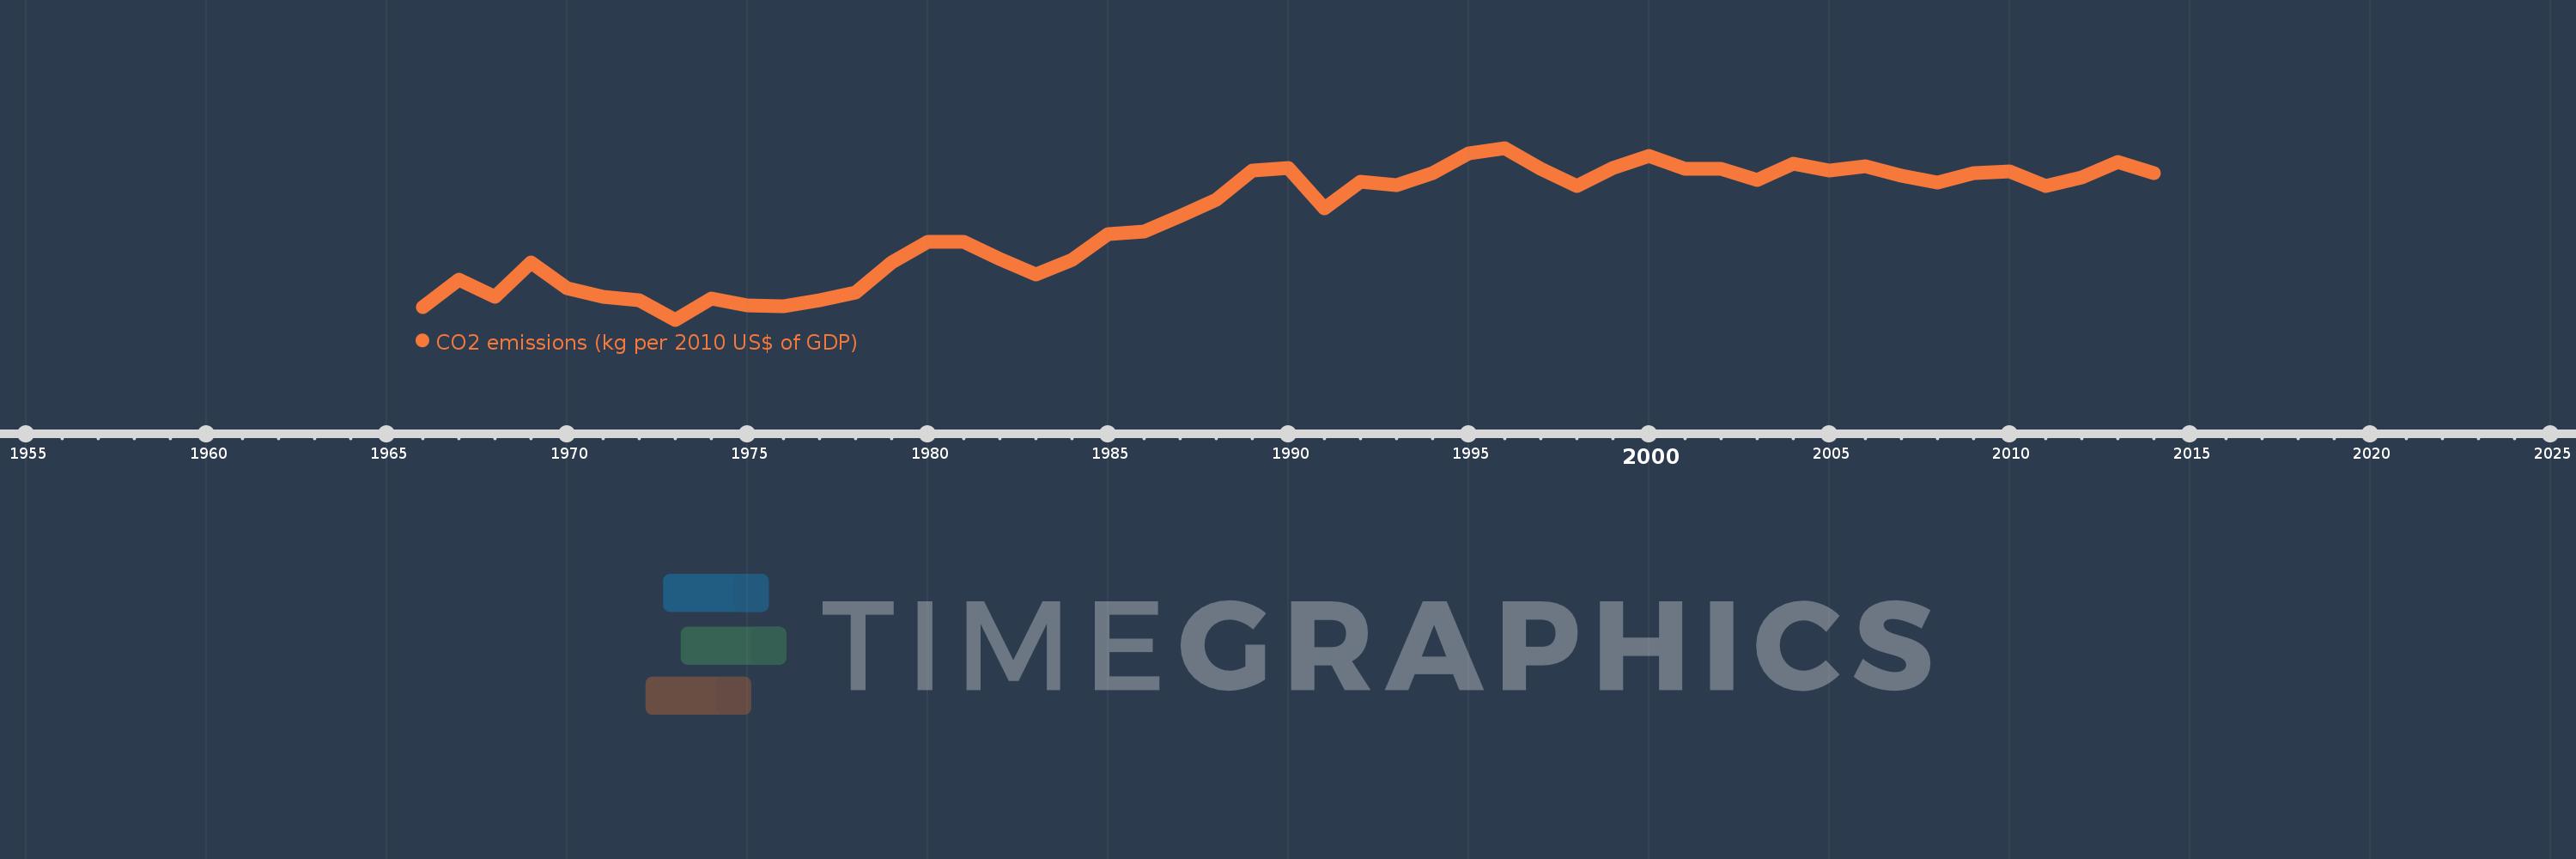
CO2 emissions (kg per 2010 US$ of GDP)
2014,2013,2012,2011,2010,2009,2008,2007,2006,2005,2004,2003,2002,2001,2000,1999,1998,1997,1996,1995,1994,1993,1992,1991,1990,1989,1988,1987,1986,1985,1984,1983,1982,1981,1980,1979,1978,1977,1976,1975,1974,1973,1972,1971,1970,1969,1968,1967,1966
This statistics in other country:
AfghanistanAlbaniaAlgeriaAndorraAngolaAntigua and BarbudaArab WorldArgentinaArmeniaArubaAustraliaAustriaAzerbaijanBahamas, TheBahrainBangladeshBarbadosBelarusBelgiumBelizeBeninBermudaBhutanBoliviaBosnia and HerzegovinaBotswanaBrazilBrunei DarussalamBulgariaBurkina FasoBurundiCabo VerdeCambodiaCameroonCanadaCaribbean small statesCentral African RepublicCentral Europe and the BalticsChadChileChinaColombiaComorosCongo, Dem. Rep.Congo, Rep.Costa RicaCote d'IvoireCroatiaCubaCyprusCzech RepublicDenmarkDjiboutiDominicaDominican RepublicEarly-demographic dividendEast Asia & PacificEast Asia & Pacific (excluding high income)East Asia & Pacific (IDA & IBRD countries)EcuadorEgypt, Arab Rep.El SalvadorEquatorial GuineaEritreaEstoniaEthiopiaEuro areaEurope & Central AsiaEurope & Central Asia (excluding high income)Europe & Central Asia (IDA & IBRD countries)European UnionFaroe IslandsFijiFinlandFragile and conflict affected situationsFranceGabonGambia, TheGeorgiaGermanyGhanaGreeceGreenlandGrenadaGuatemalaGuineaGuinea-BissauGuyanaHaitiHeavily indebted poor countries (HIPC)High incomeHondurasHong Kong SAR, ChinaHungaryIBRD onlyIcelandIDA & IBRD totalIDA blendIDA onlyIDA totalIndiaIndonesiaIran, Islamic Rep.IraqIrelandIsraelItalyJamaicaJapanJordanKazakhstanKenyaKiribatiKorea, Rep.KuwaitKyrgyz RepublicLao PDRLate-demographic dividendLatin America & Caribbean Latin America & Caribbean (excluding high income)Latin America & the Caribbean (IDA & IBRD countries)LatviaLeast developed countries: UN classificationLebanonLesothoLiberiaLibyaLiechtensteinLithuaniaLow & middle incomeLow incomeLower middle incomeLuxembourgMacao SAR, ChinaMacedonia, FYRMadagascarMalawiMalaysiaMaldivesMaliMaltaMarshall IslandsMauritaniaMauritiusMexicoMicronesia, Fed. Sts.Middle East & North AfricaMiddle East & North Africa (excluding high income)Middle East & North Africa (IDA & IBRD countries)Middle incomeMoldovaMongoliaMontenegroMoroccoMozambiqueMyanmarNamibiaNauruNepalNetherlandsNew ZealandNicaraguaNigerNigeriaNorth AmericaNorwayOECD membersOmanOther small statesPacific island small statesPakistanPalauPanamaPapua New GuineaParaguayPeruPhilippinesPolandPortugalPost-demographic dividendPre-demographic dividendQatarRomaniaRussian FederationRwandaSamoaSao Tome and PrincipeSaudi ArabiaSenegalSerbiaSeychellesSierra LeoneSingaporeSlovak RepublicSloveniaSmall statesSolomon IslandsSouth AfricaSouth AsiaSouth Asia (IDA & IBRD)South SudanSpainSri LankaSt. Kitts and NevisSt. LuciaSt. Vincent and the GrenadinesSub-Saharan Africa Sub-Saharan Africa (excluding high income)Sub-Saharan Africa (IDA & IBRD countries)SudanSurinameSwazilandSwedenSwitzerlandTajikistanTanzaniaThailandTimor-LesteTogoTongaTrinidad and TobagoTunisiaTurkeyTurkmenistanUgandaUkraineUnited Arab EmiratesUnited KingdomUnited StatesUpper middle incomeUruguayUzbekistanVanuatuVenezuela, RBVietnamWest Bank and GazaWorldYemen, Rep.ZambiaZimbabwe Timeline:
This timeline shows a graph from 1966 to 2014 of Middle East & North Africa (excluding high income). No data until 1965. Number of actual observations by date: 49.
Source name:
World Development Indicators
Source organization:
Carbon Dioxide Information Analysis Center, Environmental Sciences Division, Oak Ridge National Laboratory, Tennessee, United States.
Categories, topics:
Climate Change, Environment
Last updated:
apr 23, 2017
Indicators value changes by year
At the date of observation
Value
Absolute change
Change from previous value
jan 1, 1966
0.636
+0.636
0.0%
jan 1, 1967
0.711
+0.075
11.77%
jan 1, 1968
0.664
-0.048
-6.68%
jan 1, 1969
0.756
+0.092
13.87%
jan 1, 1970
0.688
-0.068
-8.99%
jan 1, 1971
0.664
-0.024
-3.48%
jan 1, 1972
0.655
-0.009
-1.33%
jan 1, 1973
0.603
-0.052
-7.94%
jan 1, 1974
0.66
+0.057
9.42%
jan 1, 1975
0.641
-0.019
-2.88%
jan 1, 1976
0.639
-0.002
-0.28%
jan 1, 1977
0.655
+0.016
2.44%
jan 1, 1978
0.677
+0.022
3.4%
jan 1, 1979
0.756
+0.079
11.67%
jan 1, 1980
0.812
+0.056
7.46%
jan 1, 1981
0.813
+0.001
0.13%
jan 1, 1982
0.767
-0.047
-5.74%
jan 1, 1983
0.725
-0.042
-5.48%
jan 1, 1984
0.764
+0.039
5.38%
jan 1, 1985
0.832
+0.069
8.99%
jan 1, 1986
0.84
+0.007
0.9%
jan 1, 1987
0.882
+0.042
5.0%
jan 1, 1988
0.925
+0.043
4.91%
jan 1, 1989
1.003
+0.078
8.44%
jan 1, 1990
1.011
+0.008
0.76%
jan 1, 1991
0.903
-0.108
-10.66%
jan 1, 1992
0.973
+0.07
7.75%
jan 1, 1993
0.965
-0.008
-0.85%
jan 1, 1994
0.997
+0.032
3.34%
jan 1, 1995
1.049
+0.052
5.22%
jan 1, 1996
1.064
+0.015
1.43%
jan 1, 1997
1.009
-0.055
-5.14%
jan 1, 1998
0.961
-0.048
-4.75%
jan 1, 1999
1.01
+0.049
5.09%
jan 1, 2000
1.042
+0.032
3.12%
jan 1, 2001
1.007
-0.035
-3.36%
jan 1, 2002
1.009
+0.002
0.19%
jan 1, 2003
0.979
-0.03
-2.96%
jan 1, 2004
1.022
+0.043
4.4%
jan 1, 2005
1.003
-0.019
-1.87%
jan 1, 2006
1.014
+0.011
1.08%
jan 1, 2007
0.99
-0.023
-2.31%
jan 1, 2008
0.97
-0.02
-1.99%
jan 1, 2009
0.996
+0.026
2.68%
jan 1, 2010
1.0
+0.003
0.33%
jan 1, 2011
0.963
-0.036
-3.63%
jan 1, 2012
0.986
+0.022
2.33%
jan 1, 2013
1.026
+0.04
4.05%
jan 1, 2014
0.997
-0.028
-2.77%
Ranking of countries by current statistics by years


Comments: