29
/
en
AIzaSyAYiBZKx7MnpbEhh9jyipgxe19OcubqV5w
April 1, 2024
40540
Late-demographic dividend
LTE
false
2
1
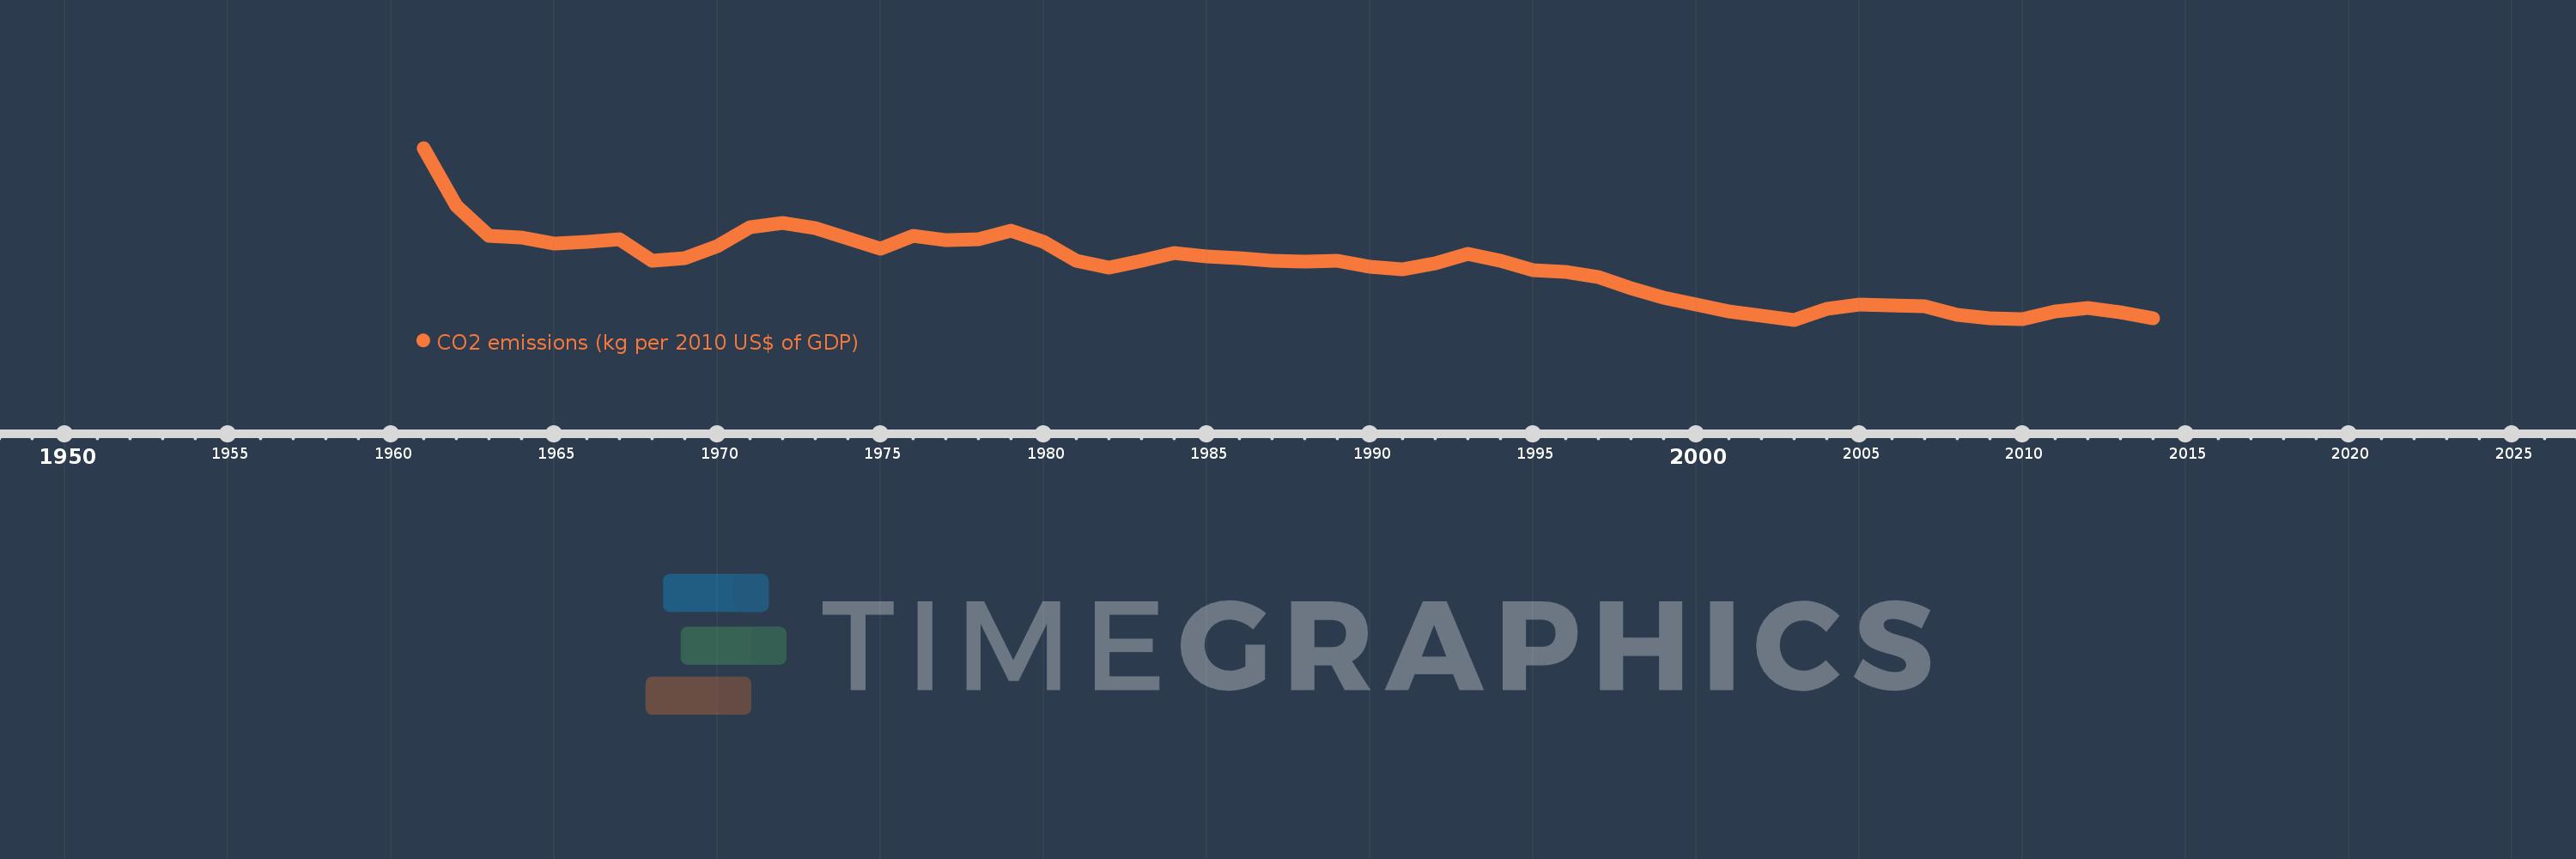
CO2 emissions (kg per 2010 US$ of GDP)
2014,2013,2012,2011,2010,2009,2008,2007,2006,2005,2004,2003,2002,2001,2000,1999,1998,1997,1996,1995,1994,1993,1992,1991,1990,1989,1988,1987,1986,1985,1984,1983,1982,1981,1980,1979,1978,1977,1976,1975,1974,1973,1972,1971,1970,1969,1968,1967,1966,1965,1964,1963,1962,1961
This statistics in other country:
AfghanistanAlbaniaAlgeriaAndorraAngolaAntigua and BarbudaArab WorldArgentinaArmeniaArubaAustraliaAustriaAzerbaijanBahamas, TheBahrainBangladeshBarbadosBelarusBelgiumBelizeBeninBermudaBhutanBoliviaBosnia and HerzegovinaBotswanaBrazilBrunei DarussalamBulgariaBurkina FasoBurundiCabo VerdeCambodiaCameroonCanadaCaribbean small statesCentral African RepublicCentral Europe and the BalticsChadChileChinaColombiaComorosCongo, Dem. Rep.Congo, Rep.Costa RicaCote d'IvoireCroatiaCubaCyprusCzech RepublicDenmarkDjiboutiDominicaDominican RepublicEarly-demographic dividendEast Asia & PacificEast Asia & Pacific (excluding high income)East Asia & Pacific (IDA & IBRD countries)EcuadorEgypt, Arab Rep.El SalvadorEquatorial GuineaEritreaEstoniaEthiopiaEuro areaEurope & Central AsiaEurope & Central Asia (excluding high income)Europe & Central Asia (IDA & IBRD countries)European UnionFaroe IslandsFijiFinlandFragile and conflict affected situationsFranceGabonGambia, TheGeorgiaGermanyGhanaGreeceGreenlandGrenadaGuatemalaGuineaGuinea-BissauGuyanaHaitiHeavily indebted poor countries (HIPC)High incomeHondurasHong Kong SAR, ChinaHungaryIBRD onlyIcelandIDA & IBRD totalIDA blendIDA onlyIDA totalIndiaIndonesiaIran, Islamic Rep.IraqIrelandIsraelItalyJamaicaJapanJordanKazakhstanKenyaKiribatiKorea, Rep.KuwaitKyrgyz RepublicLao PDRLate-demographic dividendLatin America & Caribbean Latin America & Caribbean (excluding high income)Latin America & the Caribbean (IDA & IBRD countries)LatviaLeast developed countries: UN classificationLebanonLesothoLiberiaLibyaLiechtensteinLithuaniaLow & middle incomeLow incomeLower middle incomeLuxembourgMacao SAR, ChinaMacedonia, FYRMadagascarMalawiMalaysiaMaldivesMaliMaltaMarshall IslandsMauritaniaMauritiusMexicoMicronesia, Fed. Sts.Middle East & North AfricaMiddle East & North Africa (excluding high income)Middle East & North Africa (IDA & IBRD countries)Middle incomeMoldovaMongoliaMontenegroMoroccoMozambiqueMyanmarNamibiaNauruNepalNetherlandsNew ZealandNicaraguaNigerNigeriaNorth AmericaNorwayOECD membersOmanOther small statesPacific island small statesPakistanPalauPanamaPapua New GuineaParaguayPeruPhilippinesPolandPortugalPost-demographic dividendPre-demographic dividendQatarRomaniaRussian FederationRwandaSamoaSao Tome and PrincipeSaudi ArabiaSenegalSerbiaSeychellesSierra LeoneSingaporeSlovak RepublicSloveniaSmall statesSolomon IslandsSouth AfricaSouth AsiaSouth Asia (IDA & IBRD)South SudanSpainSri LankaSt. Kitts and NevisSt. LuciaSt. Vincent and the GrenadinesSub-Saharan Africa Sub-Saharan Africa (excluding high income)Sub-Saharan Africa (IDA & IBRD countries)SudanSurinameSwazilandSwedenSwitzerlandTajikistanTanzaniaThailandTimor-LesteTogoTongaTrinidad and TobagoTunisiaTurkeyTurkmenistanUgandaUkraineUnited Arab EmiratesUnited KingdomUnited StatesUpper middle incomeUruguayUzbekistanVanuatuVenezuela, RBVietnamWest Bank and GazaWorldYemen, Rep.ZambiaZimbabwe Timeline:
This timeline shows a graph from 1961 to 2014 of Late-demographic dividend. No data until 1960. Number of actual observations by date: 54.
Source name:
World Development Indicators
Source organization:
Carbon Dioxide Information Analysis Center, Environmental Sciences Division, Oak Ridge National Laboratory, Tennessee, United States.
Categories, topics:
Climate Change, Environment
Last updated:
apr 23, 2017
Indicators value changes by year
At the date of observation
Value
Absolute change
Change from previous value
jan 1, 1961
1.916
+1.916
0.0%
jan 1, 1962
1.586
-0.33
-17.21%
jan 1, 1963
1.415
-0.171
-10.79%
jan 1, 1964
1.403
-0.011
-0.79%
jan 1, 1965
1.37
-0.033
-2.38%
jan 1, 1966
1.378
+0.008
0.58%
jan 1, 1967
1.395
+0.017
1.23%
jan 1, 1968
1.272
-0.123
-8.81%
jan 1, 1969
1.287
+0.015
1.17%
jan 1, 1970
1.357
+0.07
5.46%
jan 1, 1971
1.463
+0.106
7.82%
jan 1, 1972
1.487
+0.024
1.64%
jan 1, 1973
1.458
-0.029
-1.96%
jan 1, 1974
1.4
-0.058
-4.0%
jan 1, 1975
1.34
-0.06
-4.29%
jan 1, 1976
1.415
+0.075
5.6%
jan 1, 1977
1.389
-0.026
-1.84%
jan 1, 1978
1.397
+0.008
0.6%
jan 1, 1979
1.444
+0.047
3.34%
jan 1, 1980
1.38
-0.064
-4.45%
jan 1, 1981
1.274
-0.105
-7.63%
jan 1, 1982
1.233
-0.042
-3.27%
jan 1, 1983
1.273
+0.04
3.25%
jan 1, 1984
1.314
+0.041
3.2%
jan 1, 1985
1.297
-0.017
-1.29%
jan 1, 1986
1.289
-0.007
-0.56%
jan 1, 1987
1.273
-0.016
-1.26%
jan 1, 1988
1.269
-0.005
-0.36%
jan 1, 1989
1.271
+0.002
0.17%
jan 1, 1990
1.238
-0.033
-2.59%
jan 1, 1991
1.224
-0.013
-1.08%
jan 1, 1992
1.255
+0.03
2.45%
jan 1, 1993
1.309
+0.054
4.31%
jan 1, 1994
1.274
-0.035
-2.67%
jan 1, 1995
1.219
-0.055
-4.3%
jan 1, 1996
1.206
-0.013
-1.06%
jan 1, 1997
1.18
-0.026
-2.13%
jan 1, 1998
1.114
-0.066
-5.6%
jan 1, 1999
1.061
-0.053
-4.75%
jan 1, 2000
1.021
-0.04
-3.79%
jan 1, 2001
0.983
-0.038
-3.76%
jan 1, 2002
0.958
-0.025
-2.53%
jan 1, 2003
0.935
-0.023
-2.42%
jan 1, 2004
0.998
+0.063
6.75%
jan 1, 2005
1.023
+0.026
2.59%
jan 1, 2006
1.016
-0.007
-0.7%
jan 1, 2007
1.011
-0.006
-0.55%
jan 1, 2008
0.961
-0.05
-4.92%
jan 1, 2009
0.944
-0.017
-1.79%
jan 1, 2010
0.94
-0.004
-0.42%
jan 1, 2011
0.984
+0.044
4.67%
jan 1, 2012
1.001
+0.017
1.75%
jan 1, 2013
0.978
-0.023
-2.29%
jan 1, 2014
0.945
-0.033
-3.35%
Ranking of countries by current statistics by years


Comments: