29
/
en
AIzaSyAYiBZKx7MnpbEhh9jyipgxe19OcubqV5w
April 1, 2024
28922
East Asia & Pacific (IDA & IBRD countries)
TEA
false
2
1
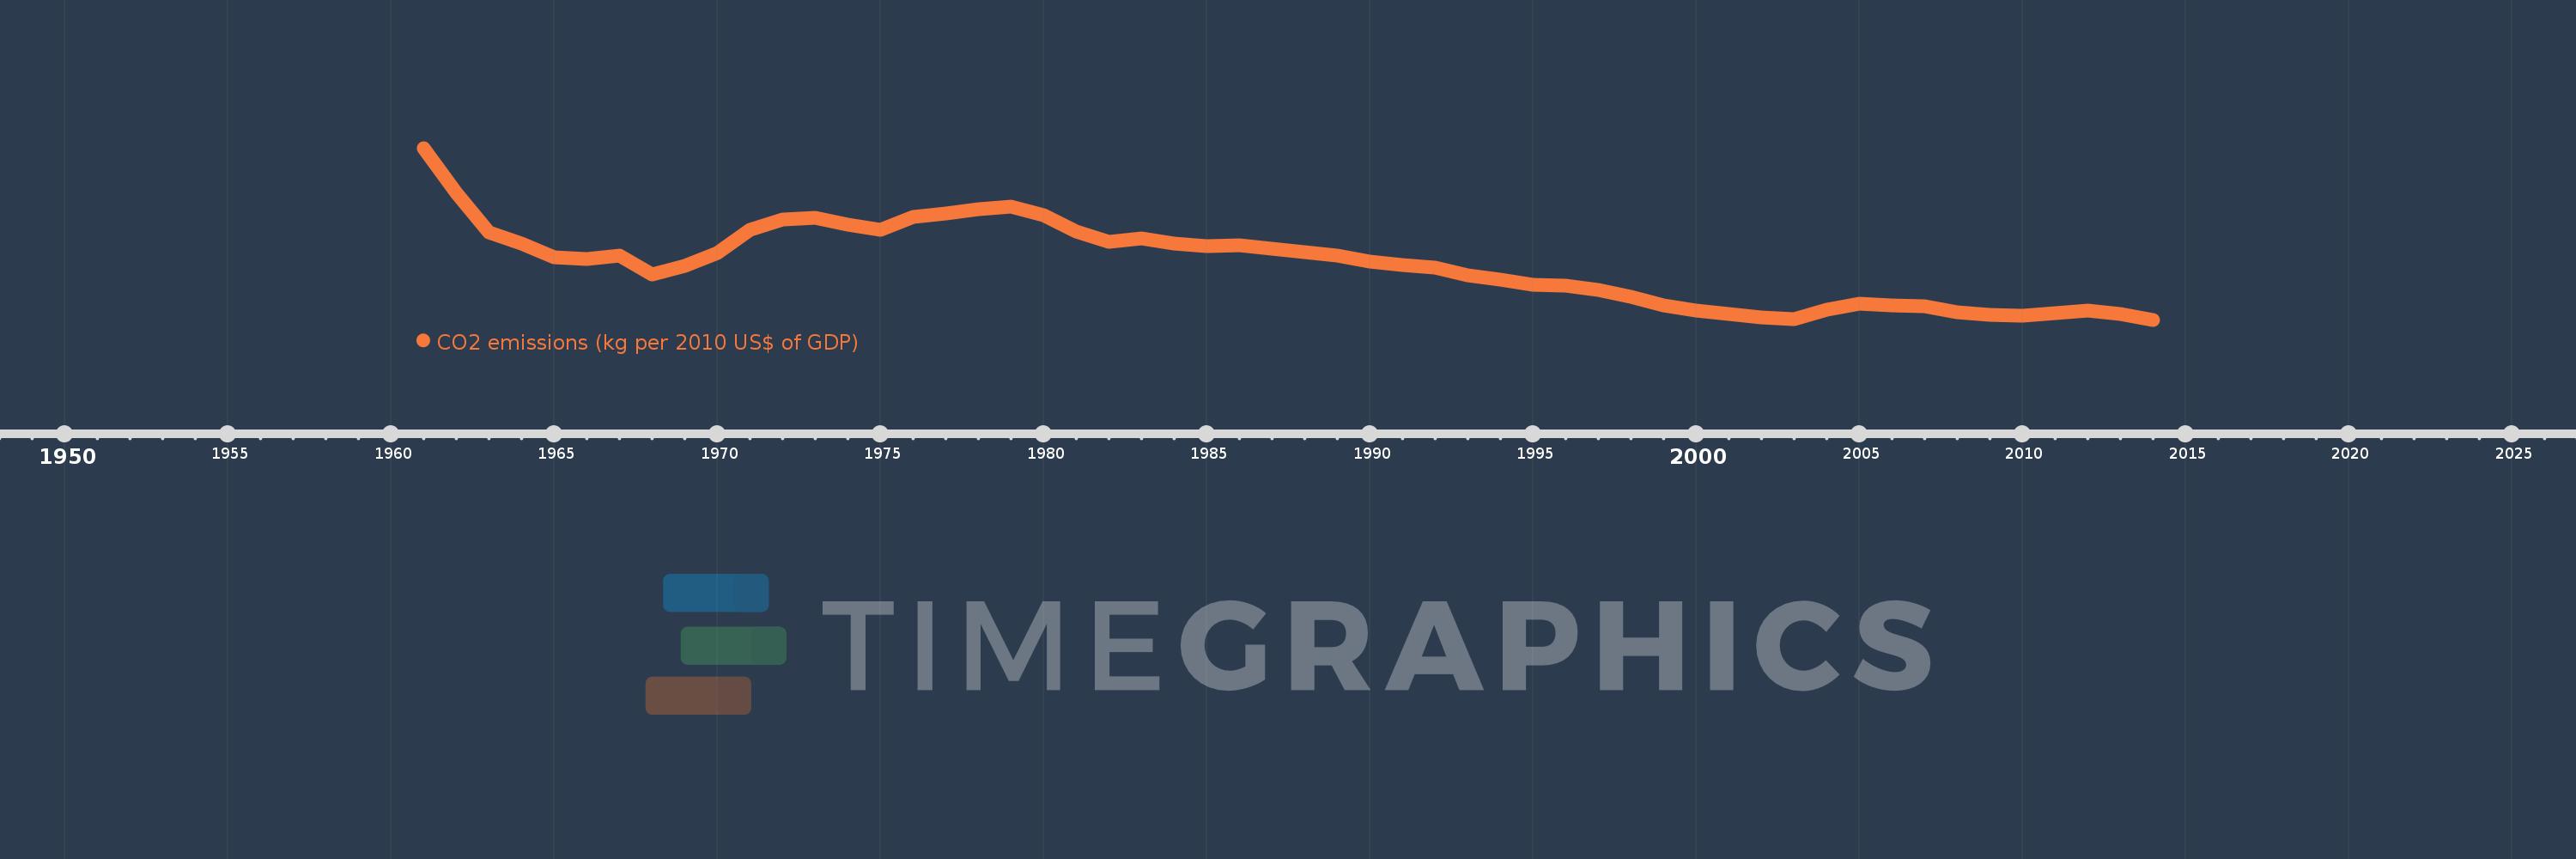
CO2 emissions (kg per 2010 US$ of GDP)
2014,2013,2012,2011,2010,2009,2008,2007,2006,2005,2004,2003,2002,2001,2000,1999,1998,1997,1996,1995,1994,1993,1992,1991,1990,1989,1988,1987,1986,1985,1984,1983,1982,1981,1980,1979,1978,1977,1976,1975,1974,1973,1972,1971,1970,1969,1968,1967,1966,1965,1964,1963,1962,1961
This statistics in other country:
AfghanistanAlbaniaAlgeriaAndorraAngolaAntigua and BarbudaArab WorldArgentinaArmeniaArubaAustraliaAustriaAzerbaijanBahamas, TheBahrainBangladeshBarbadosBelarusBelgiumBelizeBeninBermudaBhutanBoliviaBosnia and HerzegovinaBotswanaBrazilBrunei DarussalamBulgariaBurkina FasoBurundiCabo VerdeCambodiaCameroonCanadaCaribbean small statesCentral African RepublicCentral Europe and the BalticsChadChileChinaColombiaComorosCongo, Dem. Rep.Congo, Rep.Costa RicaCote d'IvoireCroatiaCubaCyprusCzech RepublicDenmarkDjiboutiDominicaDominican RepublicEarly-demographic dividendEast Asia & PacificEast Asia & Pacific (excluding high income)East Asia & Pacific (IDA & IBRD countries)EcuadorEgypt, Arab Rep.El SalvadorEquatorial GuineaEritreaEstoniaEthiopiaEuro areaEurope & Central AsiaEurope & Central Asia (excluding high income)Europe & Central Asia (IDA & IBRD countries)European UnionFaroe IslandsFijiFinlandFragile and conflict affected situationsFranceGabonGambia, TheGeorgiaGermanyGhanaGreeceGreenlandGrenadaGuatemalaGuineaGuinea-BissauGuyanaHaitiHeavily indebted poor countries (HIPC)High incomeHondurasHong Kong SAR, ChinaHungaryIBRD onlyIcelandIDA & IBRD totalIDA blendIDA onlyIDA totalIndiaIndonesiaIran, Islamic Rep.IraqIrelandIsraelItalyJamaicaJapanJordanKazakhstanKenyaKiribatiKorea, Rep.KuwaitKyrgyz RepublicLao PDRLate-demographic dividendLatin America & Caribbean Latin America & Caribbean (excluding high income)Latin America & the Caribbean (IDA & IBRD countries)LatviaLeast developed countries: UN classificationLebanonLesothoLiberiaLibyaLiechtensteinLithuaniaLow & middle incomeLow incomeLower middle incomeLuxembourgMacao SAR, ChinaMacedonia, FYRMadagascarMalawiMalaysiaMaldivesMaliMaltaMarshall IslandsMauritaniaMauritiusMexicoMicronesia, Fed. Sts.Middle East & North AfricaMiddle East & North Africa (excluding high income)Middle East & North Africa (IDA & IBRD countries)Middle incomeMoldovaMongoliaMontenegroMoroccoMozambiqueMyanmarNamibiaNauruNepalNetherlandsNew ZealandNicaraguaNigerNigeriaNorth AmericaNorwayOECD membersOmanOther small statesPacific island small statesPakistanPalauPanamaPapua New GuineaParaguayPeruPhilippinesPolandPortugalPost-demographic dividendPre-demographic dividendQatarRomaniaRussian FederationRwandaSamoaSao Tome and PrincipeSaudi ArabiaSenegalSerbiaSeychellesSierra LeoneSingaporeSlovak RepublicSloveniaSmall statesSolomon IslandsSouth AfricaSouth AsiaSouth Asia (IDA & IBRD)South SudanSpainSri LankaSt. Kitts and NevisSt. LuciaSt. Vincent and the GrenadinesSub-Saharan Africa Sub-Saharan Africa (excluding high income)Sub-Saharan Africa (IDA & IBRD countries)SudanSurinameSwazilandSwedenSwitzerlandTajikistanTanzaniaThailandTimor-LesteTogoTongaTrinidad and TobagoTunisiaTurkeyTurkmenistanUgandaUkraineUnited Arab EmiratesUnited KingdomUnited StatesUpper middle incomeUruguayUzbekistanVanuatuVenezuela, RBVietnamWest Bank and GazaWorldYemen, Rep.ZambiaZimbabwe Timeline:
This timeline shows a graph from 1961 to 2014 of East Asia & Pacific (IDA & IBRD countries). No data until 1960. Number of actual observations by date: 54.
Source name:
World Development Indicators
Source organization:
Carbon Dioxide Information Analysis Center, Environmental Sciences Division, Oak Ridge National Laboratory, Tennessee, United States.
Categories, topics:
Climate Change, Environment
Last updated:
apr 23, 2017
Indicators value changes by year
At the date of observation
Value
Absolute change
Change from previous value
jan 1, 1961
3.402
+3.402
0.0%
jan 1, 1962
2.82
-0.582
-17.1%
jan 1, 1963
2.312
-0.508
-18.02%
jan 1, 1964
2.165
-0.147
-6.35%
jan 1, 1965
1.992
-0.173
-7.97%
jan 1, 1966
1.966
-0.026
-1.32%
jan 1, 1967
2.013
+0.047
2.37%
jan 1, 1968
1.767
-0.246
-12.21%
jan 1, 1969
1.882
+0.115
6.5%
jan 1, 1970
2.046
+0.164
8.7%
jan 1, 1971
2.345
+0.3
14.66%
jan 1, 1972
2.478
+0.133
5.65%
jan 1, 1973
2.497
+0.019
0.76%
jan 1, 1974
2.408
-0.089
-3.57%
jan 1, 1975
2.342
-0.066
-2.73%
jan 1, 1976
2.511
+0.169
7.21%
jan 1, 1977
2.55
+0.04
1.58%
jan 1, 1978
2.611
+0.061
2.38%
jan 1, 1979
2.644
+0.033
1.26%
jan 1, 1980
2.53
-0.114
-4.3%
jan 1, 1981
2.326
-0.205
-8.09%
jan 1, 1982
2.184
-0.142
-6.1%
jan 1, 1983
2.227
+0.043
1.96%
jan 1, 1984
2.167
-0.06
-2.68%
jan 1, 1985
2.132
-0.035
-1.63%
jan 1, 1986
2.144
+0.012
0.57%
jan 1, 1987
2.104
-0.04
-1.86%
jan 1, 1988
2.059
-0.045
-2.13%
jan 1, 1989
2.014
-0.045
-2.2%
jan 1, 1990
1.932
-0.082
-4.05%
jan 1, 1991
1.892
-0.041
-2.11%
jan 1, 1992
1.856
-0.036
-1.89%
jan 1, 1993
1.759
-0.097
-5.2%
jan 1, 1994
1.7
-0.059
-3.37%
jan 1, 1995
1.628
-0.072
-4.23%
jan 1, 1996
1.616
-0.012
-0.73%
jan 1, 1997
1.56
-0.056
-3.46%
jan 1, 1998
1.477
-0.083
-5.31%
jan 1, 1999
1.367
-0.11
-7.45%
jan 1, 2000
1.299
-0.068
-5.01%
jan 1, 2001
1.251
-0.047
-3.65%
jan 1, 2002
1.213
-0.038
-3.06%
jan 1, 2003
1.188
-0.025
-2.05%
jan 1, 2004
1.309
+0.12
10.13%
jan 1, 2005
1.385
+0.077
5.85%
jan 1, 2006
1.37
-0.015
-1.11%
jan 1, 2007
1.352
-0.018
-1.33%
jan 1, 2008
1.275
-0.077
-5.69%
jan 1, 2009
1.245
-0.03
-2.32%
jan 1, 2010
1.227
-0.019
-1.49%
jan 1, 2011
1.271
+0.044
3.59%
jan 1, 2012
1.304
+0.033
2.58%
jan 1, 2013
1.25
-0.054
-4.13%
jan 1, 2014
1.18
-0.07
-5.62%
Ranking of countries by current statistics by years


Comments: