29
/
en
AIzaSyAYiBZKx7MnpbEhh9jyipgxe19OcubqV5w
April 1, 2024
132946
Finland
FIN
true
2
1
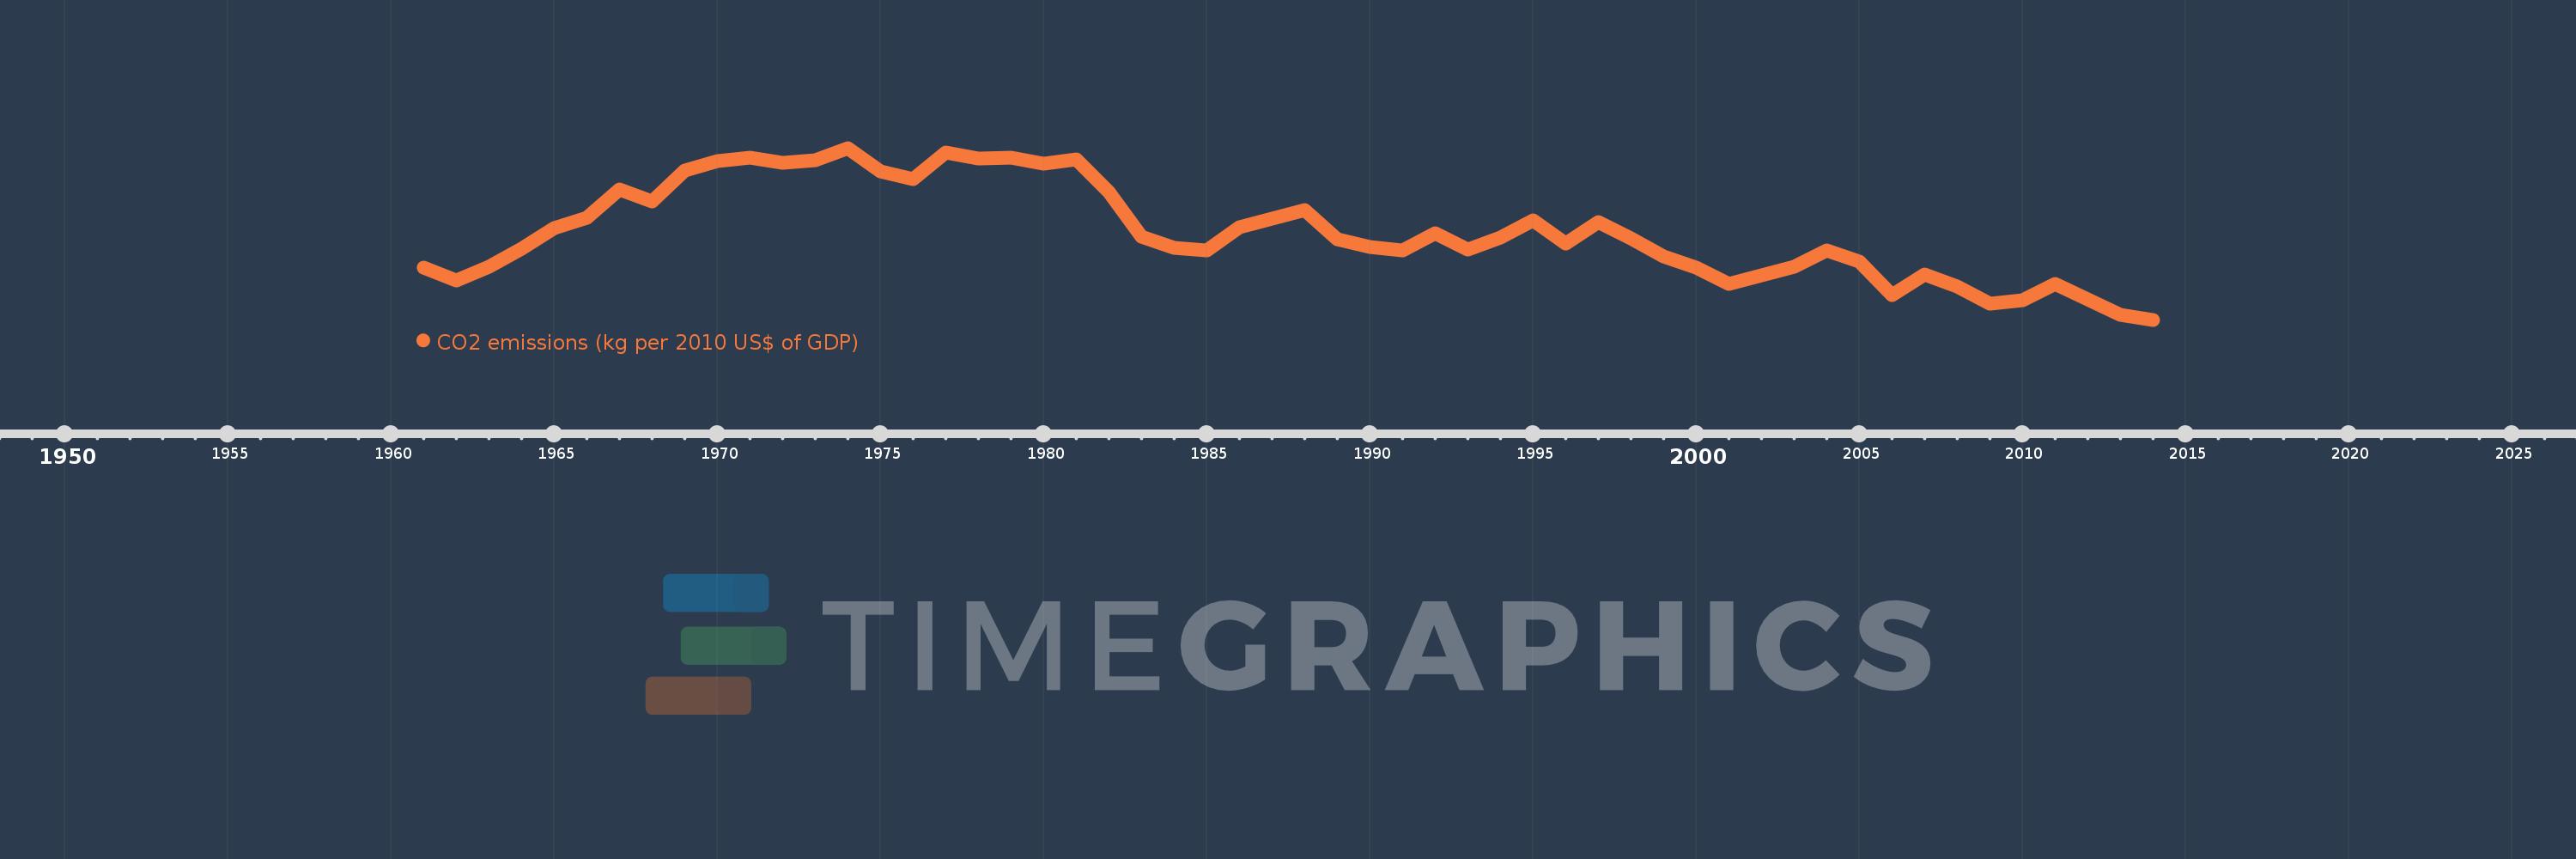
CO2 emissions (kg per 2010 US$ of GDP)
2014,2013,2012,2011,2010,2009,2008,2007,2006,2005,2004,2003,2002,2001,2000,1999,1998,1997,1996,1995,1994,1993,1992,1991,1990,1989,1988,1987,1986,1985,1984,1983,1982,1981,1980,1979,1978,1977,1976,1975,1974,1973,1972,1971,1970,1969,1968,1967,1966,1965,1964,1963,1962,1961
This statistics in other country:
AfghanistanAlbaniaAlgeriaAndorraAngolaAntigua and BarbudaArab WorldArgentinaArmeniaArubaAustraliaAustriaAzerbaijanBahamas, TheBahrainBangladeshBarbadosBelarusBelgiumBelizeBeninBermudaBhutanBoliviaBosnia and HerzegovinaBotswanaBrazilBrunei DarussalamBulgariaBurkina FasoBurundiCabo VerdeCambodiaCameroonCanadaCaribbean small statesCentral African RepublicCentral Europe and the BalticsChadChileChinaColombiaComorosCongo, Dem. Rep.Congo, Rep.Costa RicaCote d'IvoireCroatiaCubaCyprusCzech RepublicDenmarkDjiboutiDominicaDominican RepublicEarly-demographic dividendEast Asia & PacificEast Asia & Pacific (excluding high income)East Asia & Pacific (IDA & IBRD countries)EcuadorEgypt, Arab Rep.El SalvadorEquatorial GuineaEritreaEstoniaEthiopiaEuro areaEurope & Central AsiaEurope & Central Asia (excluding high income)Europe & Central Asia (IDA & IBRD countries)European UnionFaroe IslandsFijiFinlandFragile and conflict affected situationsFranceGabonGambia, TheGeorgiaGermanyGhanaGreeceGreenlandGrenadaGuatemalaGuineaGuinea-BissauGuyanaHaitiHeavily indebted poor countries (HIPC)High incomeHondurasHong Kong SAR, ChinaHungaryIBRD onlyIcelandIDA & IBRD totalIDA blendIDA onlyIDA totalIndiaIndonesiaIran, Islamic Rep.IraqIrelandIsraelItalyJamaicaJapanJordanKazakhstanKenyaKiribatiKorea, Rep.KuwaitKyrgyz RepublicLao PDRLate-demographic dividendLatin America & Caribbean Latin America & Caribbean (excluding high income)Latin America & the Caribbean (IDA & IBRD countries)LatviaLeast developed countries: UN classificationLebanonLesothoLiberiaLibyaLiechtensteinLithuaniaLow & middle incomeLow incomeLower middle incomeLuxembourgMacao SAR, ChinaMacedonia, FYRMadagascarMalawiMalaysiaMaldivesMaliMaltaMarshall IslandsMauritaniaMauritiusMexicoMicronesia, Fed. Sts.Middle East & North AfricaMiddle East & North Africa (excluding high income)Middle East & North Africa (IDA & IBRD countries)Middle incomeMoldovaMongoliaMontenegroMoroccoMozambiqueMyanmarNamibiaNauruNepalNetherlandsNew ZealandNicaraguaNigerNigeriaNorth AmericaNorwayOECD membersOmanOther small statesPacific island small statesPakistanPalauPanamaPapua New GuineaParaguayPeruPhilippinesPolandPortugalPost-demographic dividendPre-demographic dividendQatarRomaniaRussian FederationRwandaSamoaSao Tome and PrincipeSaudi ArabiaSenegalSerbiaSeychellesSierra LeoneSingaporeSlovak RepublicSloveniaSmall statesSolomon IslandsSouth AfricaSouth AsiaSouth Asia (IDA & IBRD)South SudanSpainSri LankaSt. Kitts and NevisSt. LuciaSt. Vincent and the GrenadinesSub-Saharan Africa Sub-Saharan Africa (excluding high income)Sub-Saharan Africa (IDA & IBRD countries)SudanSurinameSwazilandSwedenSwitzerlandTajikistanTanzaniaThailandTimor-LesteTogoTongaTrinidad and TobagoTunisiaTurkeyTurkmenistanUgandaUkraineUnited Arab EmiratesUnited KingdomUnited StatesUpper middle incomeUruguayUzbekistanVanuatuVenezuela, RBVietnamWest Bank and GazaWorldYemen, Rep.ZambiaZimbabwe Timeline:
This timeline shows a graph from 1961 to 2014 of Finland. No data until 1960. Number of actual observations by date: 54.
Source name:
World Development Indicators
Source organization:
Carbon Dioxide Information Analysis Center, Environmental Sciences Division, Oak Ridge National Laboratory, Tennessee, United States.
Categories, topics:
Climate Change, Environment
Last updated:
apr 23, 2017
Indicators value changes by year
At the date of observation
Value
Absolute change
Change from previous value
jan 1, 1961
0.28
+0.28
0.0%
jan 1, 1962
0.257
-0.023
-8.08%
jan 1, 1963
0.281
+0.024
9.26%
jan 1, 1964
0.313
+0.032
11.5%
jan 1, 1965
0.351
+0.038
12.18%
jan 1, 1966
0.37
+0.018
5.25%
jan 1, 1967
0.421
+0.051
13.85%
jan 1, 1968
0.399
-0.022
-5.11%
jan 1, 1969
0.454
+0.055
13.79%
jan 1, 1970
0.472
+0.018
3.9%
jan 1, 1971
0.477
+0.005
1.09%
jan 1, 1972
0.468
-0.009
-1.85%
jan 1, 1973
0.473
+0.005
1.01%
jan 1, 1974
0.495
+0.021
4.53%
jan 1, 1975
0.453
-0.042
-8.44%
jan 1, 1976
0.439
-0.014
-2.99%
jan 1, 1977
0.487
+0.048
10.85%
jan 1, 1978
0.476
-0.011
-2.3%
jan 1, 1979
0.478
+0.002
0.44%
jan 1, 1980
0.467
-0.011
-2.3%
jan 1, 1981
0.475
+0.008
1.72%
jan 1, 1982
0.415
-0.06
-12.7%
jan 1, 1983
0.336
-0.078
-18.86%
jan 1, 1984
0.315
-0.022
-6.42%
jan 1, 1985
0.31
-0.005
-1.53%
jan 1, 1986
0.352
+0.042
13.52%
jan 1, 1987
0.368
+0.016
4.53%
jan 1, 1988
0.384
+0.016
4.4%
jan 1, 1989
0.33
-0.054
-13.97%
jan 1, 1990
0.317
-0.014
-4.11%
jan 1, 1991
0.31
-0.007
-2.26%
jan 1, 1992
0.342
+0.032
10.3%
jan 1, 1993
0.312
-0.029
-8.55%
jan 1, 1994
0.334
+0.022
6.96%
jan 1, 1995
0.365
+0.031
9.23%
jan 1, 1996
0.323
-0.042
-11.6%
jan 1, 1997
0.362
+0.039
12.15%
jan 1, 1998
0.333
-0.029
-7.96%
jan 1, 1999
0.3
-0.033
-9.81%
jan 1, 2000
0.28
-0.021
-6.89%
jan 1, 2001
0.25
-0.029
-10.45%
jan 1, 2002
0.266
+0.015
6.08%
jan 1, 2003
0.282
+0.017
6.33%
jan 1, 2004
0.31
+0.028
9.88%
jan 1, 2005
0.29
-0.021
-6.62%
jan 1, 2006
0.23
-0.06
-20.75%
jan 1, 2007
0.267
+0.038
16.42%
jan 1, 2008
0.246
-0.022
-8.11%
jan 1, 2009
0.215
-0.03
-12.3%
jan 1, 2010
0.221
+0.005
2.51%
jan 1, 2011
0.25
+0.029
13.1%
jan 1, 2012
0.223
-0.027
-10.81%
jan 1, 2013
0.195
-0.028
-12.54%
jan 1, 2014
0.186
-0.009
-4.45%
Ranking of countries by current statistics by years


Comments: