29
/
en
AIzaSyAYiBZKx7MnpbEhh9jyipgxe19OcubqV5w
April 1, 2024
280719
Venezuela, RB
VEN
true
2
1
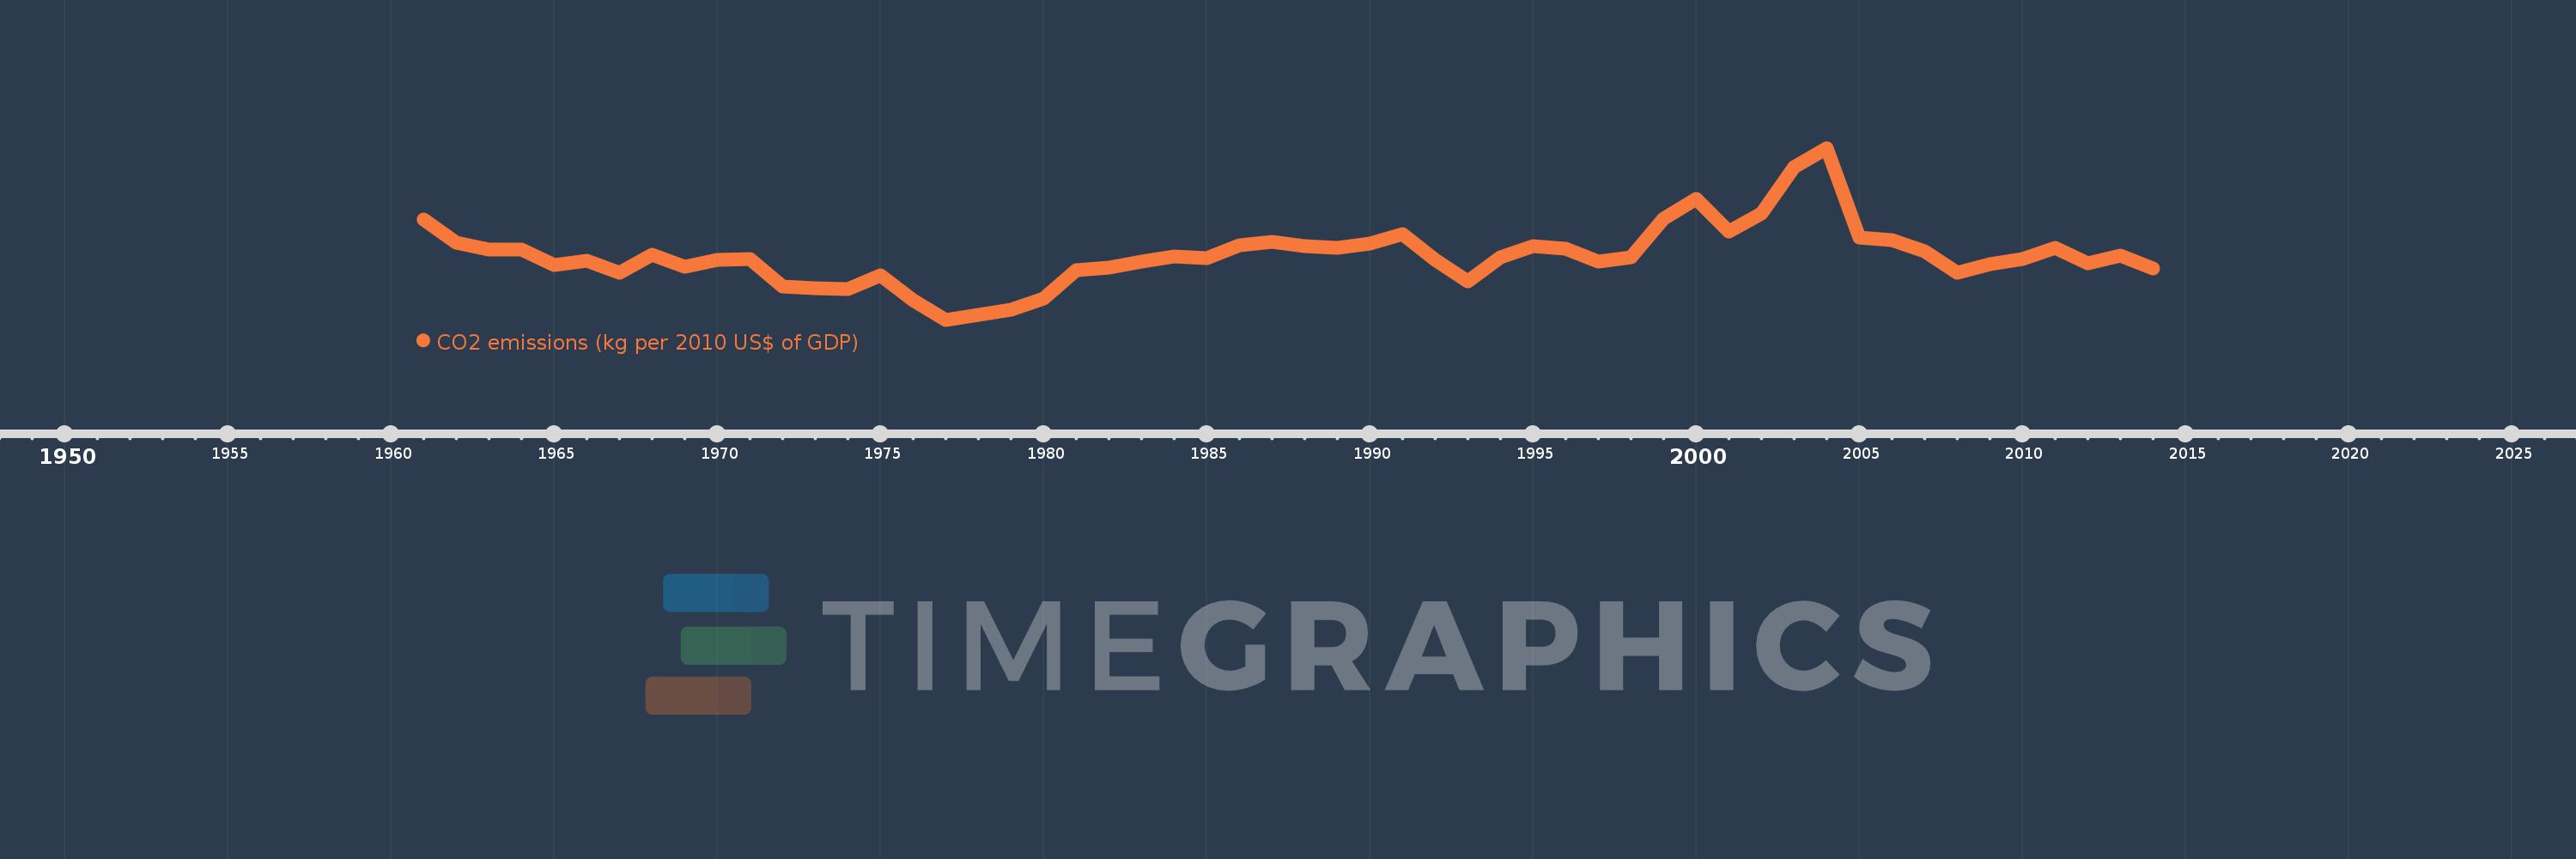
CO2 emissions (kg per 2010 US$ of GDP)
2014,2013,2012,2011,2010,2009,2008,2007,2006,2005,2004,2003,2002,2001,2000,1999,1998,1997,1996,1995,1994,1993,1992,1991,1990,1989,1988,1987,1986,1985,1984,1983,1982,1981,1980,1979,1978,1977,1976,1975,1974,1973,1972,1971,1970,1969,1968,1967,1966,1965,1964,1963,1962,1961
This statistics in other country:
AfghanistanAlbaniaAlgeriaAndorraAngolaAntigua and BarbudaArab WorldArgentinaArmeniaArubaAustraliaAustriaAzerbaijanBahamas, TheBahrainBangladeshBarbadosBelarusBelgiumBelizeBeninBermudaBhutanBoliviaBosnia and HerzegovinaBotswanaBrazilBrunei DarussalamBulgariaBurkina FasoBurundiCabo VerdeCambodiaCameroonCanadaCaribbean small statesCentral African RepublicCentral Europe and the BalticsChadChileChinaColombiaComorosCongo, Dem. Rep.Congo, Rep.Costa RicaCote d'IvoireCroatiaCubaCyprusCzech RepublicDenmarkDjiboutiDominicaDominican RepublicEarly-demographic dividendEast Asia & PacificEast Asia & Pacific (excluding high income)East Asia & Pacific (IDA & IBRD countries)EcuadorEgypt, Arab Rep.El SalvadorEquatorial GuineaEritreaEstoniaEthiopiaEuro areaEurope & Central AsiaEurope & Central Asia (excluding high income)Europe & Central Asia (IDA & IBRD countries)European UnionFaroe IslandsFijiFinlandFragile and conflict affected situationsFranceGabonGambia, TheGeorgiaGermanyGhanaGreeceGreenlandGrenadaGuatemalaGuineaGuinea-BissauGuyanaHaitiHeavily indebted poor countries (HIPC)High incomeHondurasHong Kong SAR, ChinaHungaryIBRD onlyIcelandIDA & IBRD totalIDA blendIDA onlyIDA totalIndiaIndonesiaIran, Islamic Rep.IraqIrelandIsraelItalyJamaicaJapanJordanKazakhstanKenyaKiribatiKorea, Rep.KuwaitKyrgyz RepublicLao PDRLate-demographic dividendLatin America & Caribbean Latin America & Caribbean (excluding high income)Latin America & the Caribbean (IDA & IBRD countries)LatviaLeast developed countries: UN classificationLebanonLesothoLiberiaLibyaLiechtensteinLithuaniaLow & middle incomeLow incomeLower middle incomeLuxembourgMacao SAR, ChinaMacedonia, FYRMadagascarMalawiMalaysiaMaldivesMaliMaltaMarshall IslandsMauritaniaMauritiusMexicoMicronesia, Fed. Sts.Middle East & North AfricaMiddle East & North Africa (excluding high income)Middle East & North Africa (IDA & IBRD countries)Middle incomeMoldovaMongoliaMontenegroMoroccoMozambiqueMyanmarNamibiaNauruNepalNetherlandsNew ZealandNicaraguaNigerNigeriaNorth AmericaNorwayOECD membersOmanOther small statesPacific island small statesPakistanPalauPanamaPapua New GuineaParaguayPeruPhilippinesPolandPortugalPost-demographic dividendPre-demographic dividendQatarRomaniaRussian FederationRwandaSamoaSao Tome and PrincipeSaudi ArabiaSenegalSerbiaSeychellesSierra LeoneSingaporeSlovak RepublicSloveniaSmall statesSolomon IslandsSouth AfricaSouth AsiaSouth Asia (IDA & IBRD)South SudanSpainSri LankaSt. Kitts and NevisSt. LuciaSt. Vincent and the GrenadinesSub-Saharan Africa Sub-Saharan Africa (excluding high income)Sub-Saharan Africa (IDA & IBRD countries)SudanSurinameSwazilandSwedenSwitzerlandTajikistanTanzaniaThailandTimor-LesteTogoTongaTrinidad and TobagoTunisiaTurkeyTurkmenistanUgandaUkraineUnited Arab EmiratesUnited KingdomUnited StatesUpper middle incomeUruguayUzbekistanVanuatuVenezuela, RBVietnamWest Bank and GazaWorldYemen, Rep.ZambiaZimbabwe Timeline:
This timeline shows a graph from 1961 to 2014 of Venezuela, RB. No data until 1960. Number of actual observations by date: 54.
Source name:
World Development Indicators
Source organization:
Carbon Dioxide Information Analysis Center, Environmental Sciences Division, Oak Ridge National Laboratory, Tennessee, United States.
Categories, topics:
Climate Change, Environment
Last updated:
apr 23, 2017
Indicators value changes by year
At the date of observation
Value
Absolute change
Change from previous value
jan 1, 1961
0.562
+0.562
0.0%
jan 1, 1962
0.495
-0.066
-11.82%
jan 1, 1963
0.476
-0.02
-4.0%
jan 1, 1964
0.475
0.0
-0.02%
jan 1, 1965
0.431
-0.045
-9.37%
jan 1, 1966
0.444
+0.013
3.1%
jan 1, 1967
0.411
-0.034
-7.58%
jan 1, 1968
0.461
+0.05
12.23%
jan 1, 1969
0.428
-0.033
-7.09%
jan 1, 1970
0.447
+0.019
4.39%
jan 1, 1971
0.448
+0.001
0.33%
jan 1, 1972
0.371
-0.078
-17.32%
jan 1, 1973
0.366
-0.005
-1.24%
jan 1, 1974
0.363
-0.003
-0.78%
jan 1, 1975
0.402
+0.039
10.69%
jan 1, 1976
0.332
-0.07
-17.45%
jan 1, 1977
0.277
-0.055
-16.59%
jan 1, 1978
0.29
+0.013
4.58%
jan 1, 1979
0.305
+0.015
5.31%
jan 1, 1980
0.337
+0.032
10.63%
jan 1, 1981
0.418
+0.081
24.07%
jan 1, 1982
0.425
+0.007
1.65%
jan 1, 1983
0.441
+0.016
3.71%
jan 1, 1984
0.457
+0.016
3.57%
jan 1, 1985
0.451
-0.006
-1.3%
jan 1, 1986
0.489
+0.038
8.44%
jan 1, 1987
0.497
+0.008
1.54%
jan 1, 1988
0.486
-0.011
-2.18%
jan 1, 1989
0.48
-0.006
-1.15%
jan 1, 1990
0.492
+0.012
2.55%
jan 1, 1991
0.519
+0.027
5.41%
jan 1, 1992
0.447
-0.072
-13.88%
jan 1, 1993
0.387
-0.06
-13.45%
jan 1, 1994
0.453
+0.066
17.06%
jan 1, 1995
0.485
+0.032
6.99%
jan 1, 1996
0.478
-0.006
-1.3%
jan 1, 1997
0.441
-0.037
-7.73%
jan 1, 1998
0.453
+0.011
2.57%
jan 1, 1999
0.564
+0.111
24.53%
jan 1, 2000
0.62
+0.057
10.02%
jan 1, 2001
0.527
-0.094
-15.09%
jan 1, 2002
0.577
+0.05
9.51%
jan 1, 2003
0.709
+0.132
22.89%
jan 1, 2004
0.764
+0.055
7.73%
jan 1, 2005
0.51
-0.254
-33.23%
jan 1, 2006
0.503
-0.007
-1.37%
jan 1, 2007
0.47
-0.033
-6.55%
jan 1, 2008
0.41
-0.06
-12.78%
jan 1, 2009
0.434
+0.024
5.81%
jan 1, 2010
0.45
+0.016
3.7%
jan 1, 2011
0.48
+0.03
6.75%
jan 1, 2012
0.436
-0.044
-9.22%
jan 1, 2013
0.458
+0.023
5.18%
jan 1, 2014
0.422
-0.036
-7.84%
Ranking of countries by current statistics by years


Comments: