29
/
en
AIzaSyAYiBZKx7MnpbEhh9jyipgxe19OcubqV5w
April 1, 2024
256124
Sweden
SWE
true
2
1
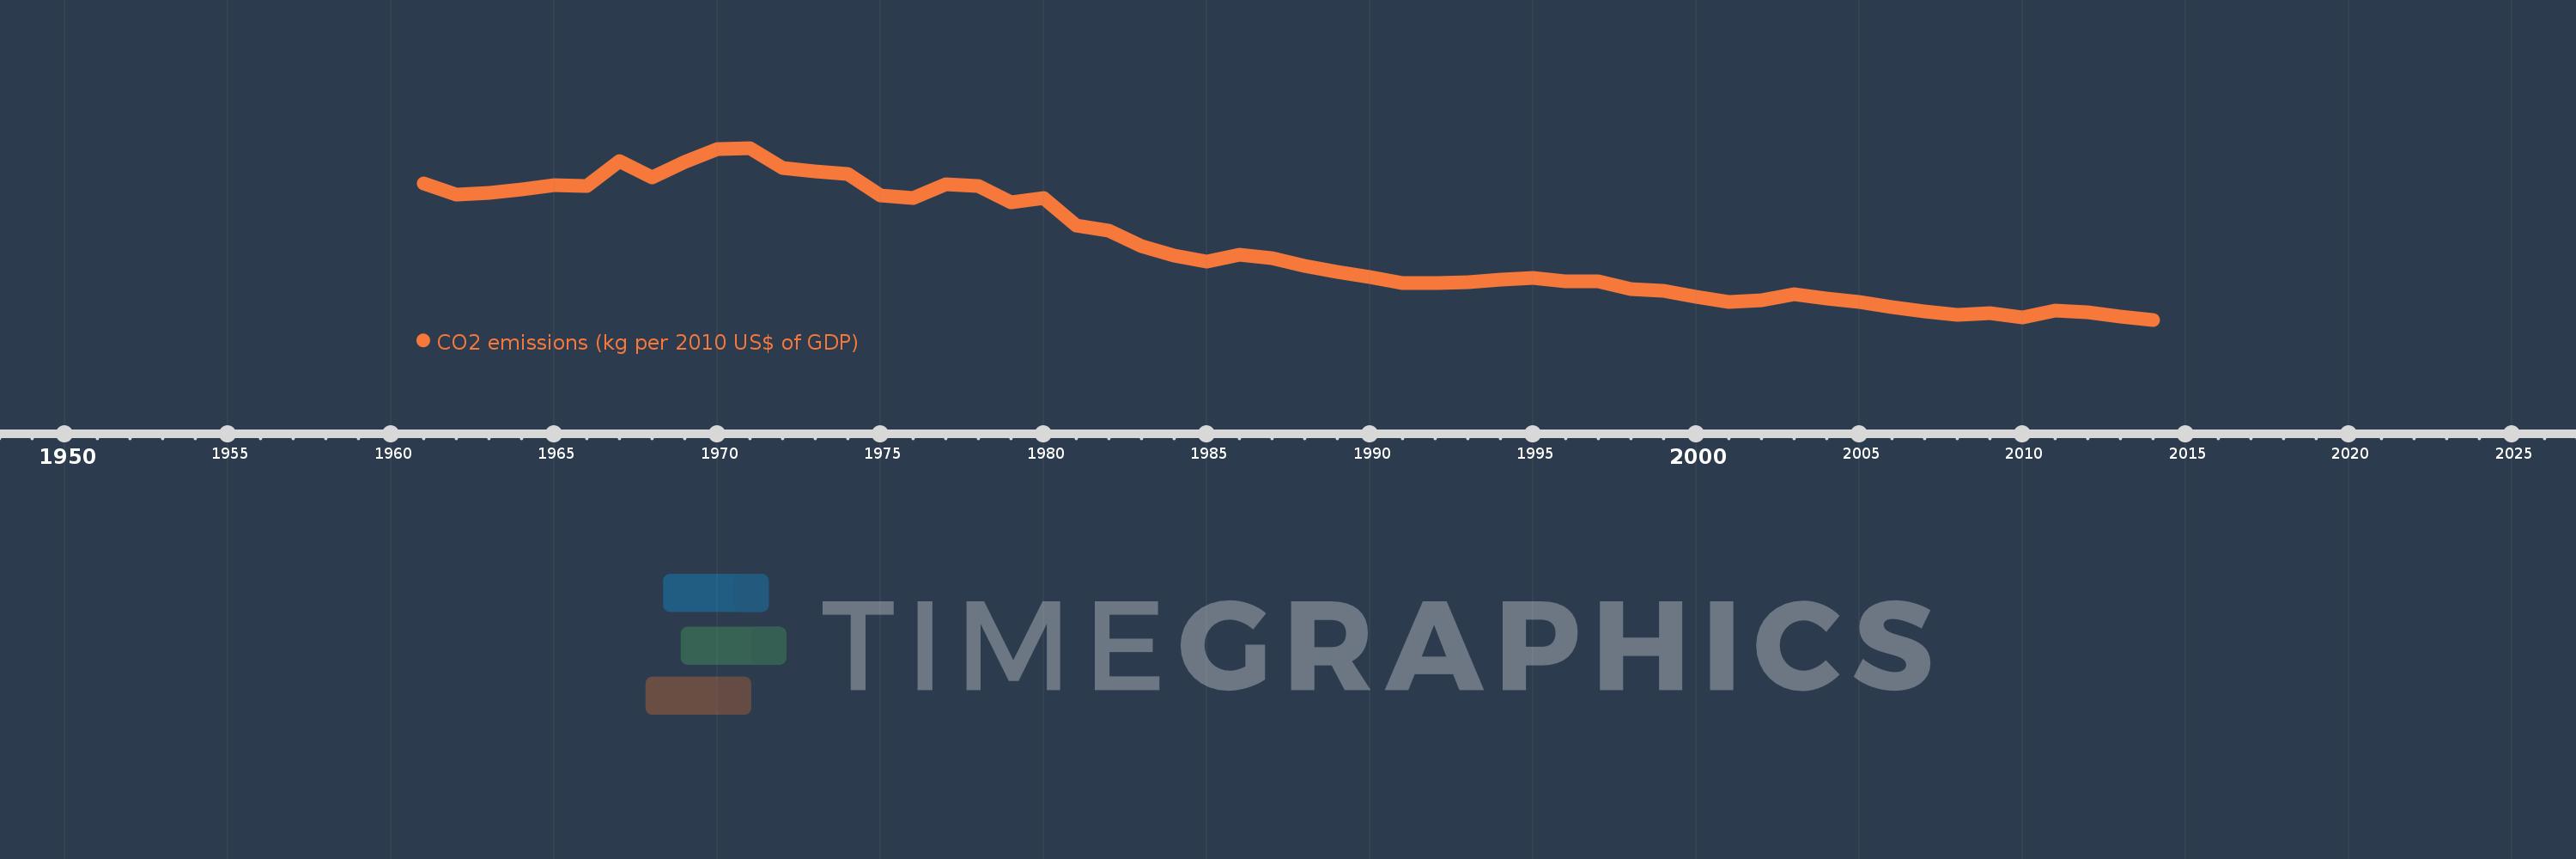
CO2 emissions (kg per 2010 US$ of GDP)
2014,2013,2012,2011,2010,2009,2008,2007,2006,2005,2004,2003,2002,2001,2000,1999,1998,1997,1996,1995,1994,1993,1992,1991,1990,1989,1988,1987,1986,1985,1984,1983,1982,1981,1980,1979,1978,1977,1976,1975,1974,1973,1972,1971,1970,1969,1968,1967,1966,1965,1964,1963,1962,1961
This statistics in other country:
AfghanistanAlbaniaAlgeriaAndorraAngolaAntigua and BarbudaArab WorldArgentinaArmeniaArubaAustraliaAustriaAzerbaijanBahamas, TheBahrainBangladeshBarbadosBelarusBelgiumBelizeBeninBermudaBhutanBoliviaBosnia and HerzegovinaBotswanaBrazilBrunei DarussalamBulgariaBurkina FasoBurundiCabo VerdeCambodiaCameroonCanadaCaribbean small statesCentral African RepublicCentral Europe and the BalticsChadChileChinaColombiaComorosCongo, Dem. Rep.Congo, Rep.Costa RicaCote d'IvoireCroatiaCubaCyprusCzech RepublicDenmarkDjiboutiDominicaDominican RepublicEarly-demographic dividendEast Asia & PacificEast Asia & Pacific (excluding high income)East Asia & Pacific (IDA & IBRD countries)EcuadorEgypt, Arab Rep.El SalvadorEquatorial GuineaEritreaEstoniaEthiopiaEuro areaEurope & Central AsiaEurope & Central Asia (excluding high income)Europe & Central Asia (IDA & IBRD countries)European UnionFaroe IslandsFijiFinlandFragile and conflict affected situationsFranceGabonGambia, TheGeorgiaGermanyGhanaGreeceGreenlandGrenadaGuatemalaGuineaGuinea-BissauGuyanaHaitiHeavily indebted poor countries (HIPC)High incomeHondurasHong Kong SAR, ChinaHungaryIBRD onlyIcelandIDA & IBRD totalIDA blendIDA onlyIDA totalIndiaIndonesiaIran, Islamic Rep.IraqIrelandIsraelItalyJamaicaJapanJordanKazakhstanKenyaKiribatiKorea, Rep.KuwaitKyrgyz RepublicLao PDRLate-demographic dividendLatin America & Caribbean Latin America & Caribbean (excluding high income)Latin America & the Caribbean (IDA & IBRD countries)LatviaLeast developed countries: UN classificationLebanonLesothoLiberiaLibyaLiechtensteinLithuaniaLow & middle incomeLow incomeLower middle incomeLuxembourgMacao SAR, ChinaMacedonia, FYRMadagascarMalawiMalaysiaMaldivesMaliMaltaMarshall IslandsMauritaniaMauritiusMexicoMicronesia, Fed. Sts.Middle East & North AfricaMiddle East & North Africa (excluding high income)Middle East & North Africa (IDA & IBRD countries)Middle incomeMoldovaMongoliaMontenegroMoroccoMozambiqueMyanmarNamibiaNauruNepalNetherlandsNew ZealandNicaraguaNigerNigeriaNorth AmericaNorwayOECD membersOmanOther small statesPacific island small statesPakistanPalauPanamaPapua New GuineaParaguayPeruPhilippinesPolandPortugalPost-demographic dividendPre-demographic dividendQatarRomaniaRussian FederationRwandaSamoaSao Tome and PrincipeSaudi ArabiaSenegalSerbiaSeychellesSierra LeoneSingaporeSlovak RepublicSloveniaSmall statesSolomon IslandsSouth AfricaSouth AsiaSouth Asia (IDA & IBRD)South SudanSpainSri LankaSt. Kitts and NevisSt. LuciaSt. Vincent and the GrenadinesSub-Saharan Africa Sub-Saharan Africa (excluding high income)Sub-Saharan Africa (IDA & IBRD countries)SudanSurinameSwazilandSwedenSwitzerlandTajikistanTanzaniaThailandTimor-LesteTogoTongaTrinidad and TobagoTunisiaTurkeyTurkmenistanUgandaUkraineUnited Arab EmiratesUnited KingdomUnited StatesUpper middle incomeUruguayUzbekistanVanuatuVenezuela, RBVietnamWest Bank and GazaWorldYemen, Rep.ZambiaZimbabwe Timeline:
This timeline shows a graph from 1961 to 2014 of Sweden. No data until 1960. Number of actual observations by date: 54.
Source name:
World Development Indicators
Source organization:
Carbon Dioxide Information Analysis Center, Environmental Sciences Division, Oak Ridge National Laboratory, Tennessee, United States.
Categories, topics:
Climate Change, Environment
Last updated:
apr 23, 2017
Indicators value changes by year
At the date of observation
Value
Absolute change
Change from previous value
jan 1, 1961
0.362
+0.362
0.0%
jan 1, 1962
0.34
-0.022
-6.09%
jan 1, 1963
0.343
+0.003
0.78%
jan 1, 1964
0.351
+0.008
2.42%
jan 1, 1965
0.359
+0.008
2.17%
jan 1, 1966
0.358
-0.001
-0.18%
jan 1, 1967
0.407
+0.048
13.53%
jan 1, 1968
0.374
-0.033
-8.04%
jan 1, 1969
0.406
+0.032
8.63%
jan 1, 1970
0.431
+0.024
6.0%
jan 1, 1971
0.434
+0.003
0.75%
jan 1, 1972
0.394
-0.04
-9.29%
jan 1, 1973
0.386
-0.008
-2.02%
jan 1, 1974
0.382
-0.003
-0.88%
jan 1, 1975
0.339
-0.044
-11.39%
jan 1, 1976
0.334
-0.005
-1.35%
jan 1, 1977
0.361
+0.027
8.12%
jan 1, 1978
0.357
-0.005
-1.26%
jan 1, 1979
0.325
-0.032
-8.9%
jan 1, 1980
0.334
+0.009
2.83%
jan 1, 1981
0.278
-0.057
-16.92%
jan 1, 1982
0.267
-0.01
-3.68%
jan 1, 1983
0.237
-0.03
-11.39%
jan 1, 1984
0.218
-0.019
-8.16%
jan 1, 1985
0.205
-0.012
-5.65%
jan 1, 1986
0.219
+0.013
6.53%
jan 1, 1987
0.212
-0.007
-3.18%
jan 1, 1988
0.197
-0.015
-6.87%
jan 1, 1989
0.185
-0.012
-6.21%
jan 1, 1990
0.174
-0.011
-5.83%
jan 1, 1991
0.162
-0.012
-7.16%
jan 1, 1992
0.162
+0.001
0.34%
jan 1, 1993
0.163
+0.0
0.19%
jan 1, 1994
0.168
+0.006
3.57%
jan 1, 1995
0.172
+0.003
1.9%
jan 1, 1996
0.166
-0.006
-3.41%
jan 1, 1997
0.166
0.0
-0.15%
jan 1, 1998
0.15
-0.015
-9.36%
jan 1, 1999
0.146
-0.004
-2.53%
jan 1, 2000
0.135
-0.011
-7.71%
jan 1, 2001
0.124
-0.011
-7.8%
jan 1, 2002
0.127
+0.002
2.0%
jan 1, 2003
0.14
+0.013
10.04%
jan 1, 2004
0.13
-0.01
-6.83%
jan 1, 2005
0.124
-0.006
-4.6%
jan 1, 2006
0.114
-0.01
-8.02%
jan 1, 2007
0.105
-0.009
-8.17%
jan 1, 2008
0.098
-0.007
-6.24%
jan 1, 2009
0.101
+0.003
2.79%
jan 1, 2010
0.093
-0.008
-7.54%
jan 1, 2011
0.107
+0.013
13.98%
jan 1, 2012
0.103
-0.003
-3.14%
jan 1, 2013
0.094
-0.009
-8.8%
jan 1, 2014
0.088
-0.007
-6.94%
Ranking of countries by current statistics by years


Comments: