29
/
en
AIzaSyAYiBZKx7MnpbEhh9jyipgxe19OcubqV5w
April 1, 2024
216145
Pakistan
PAK
true
2
1
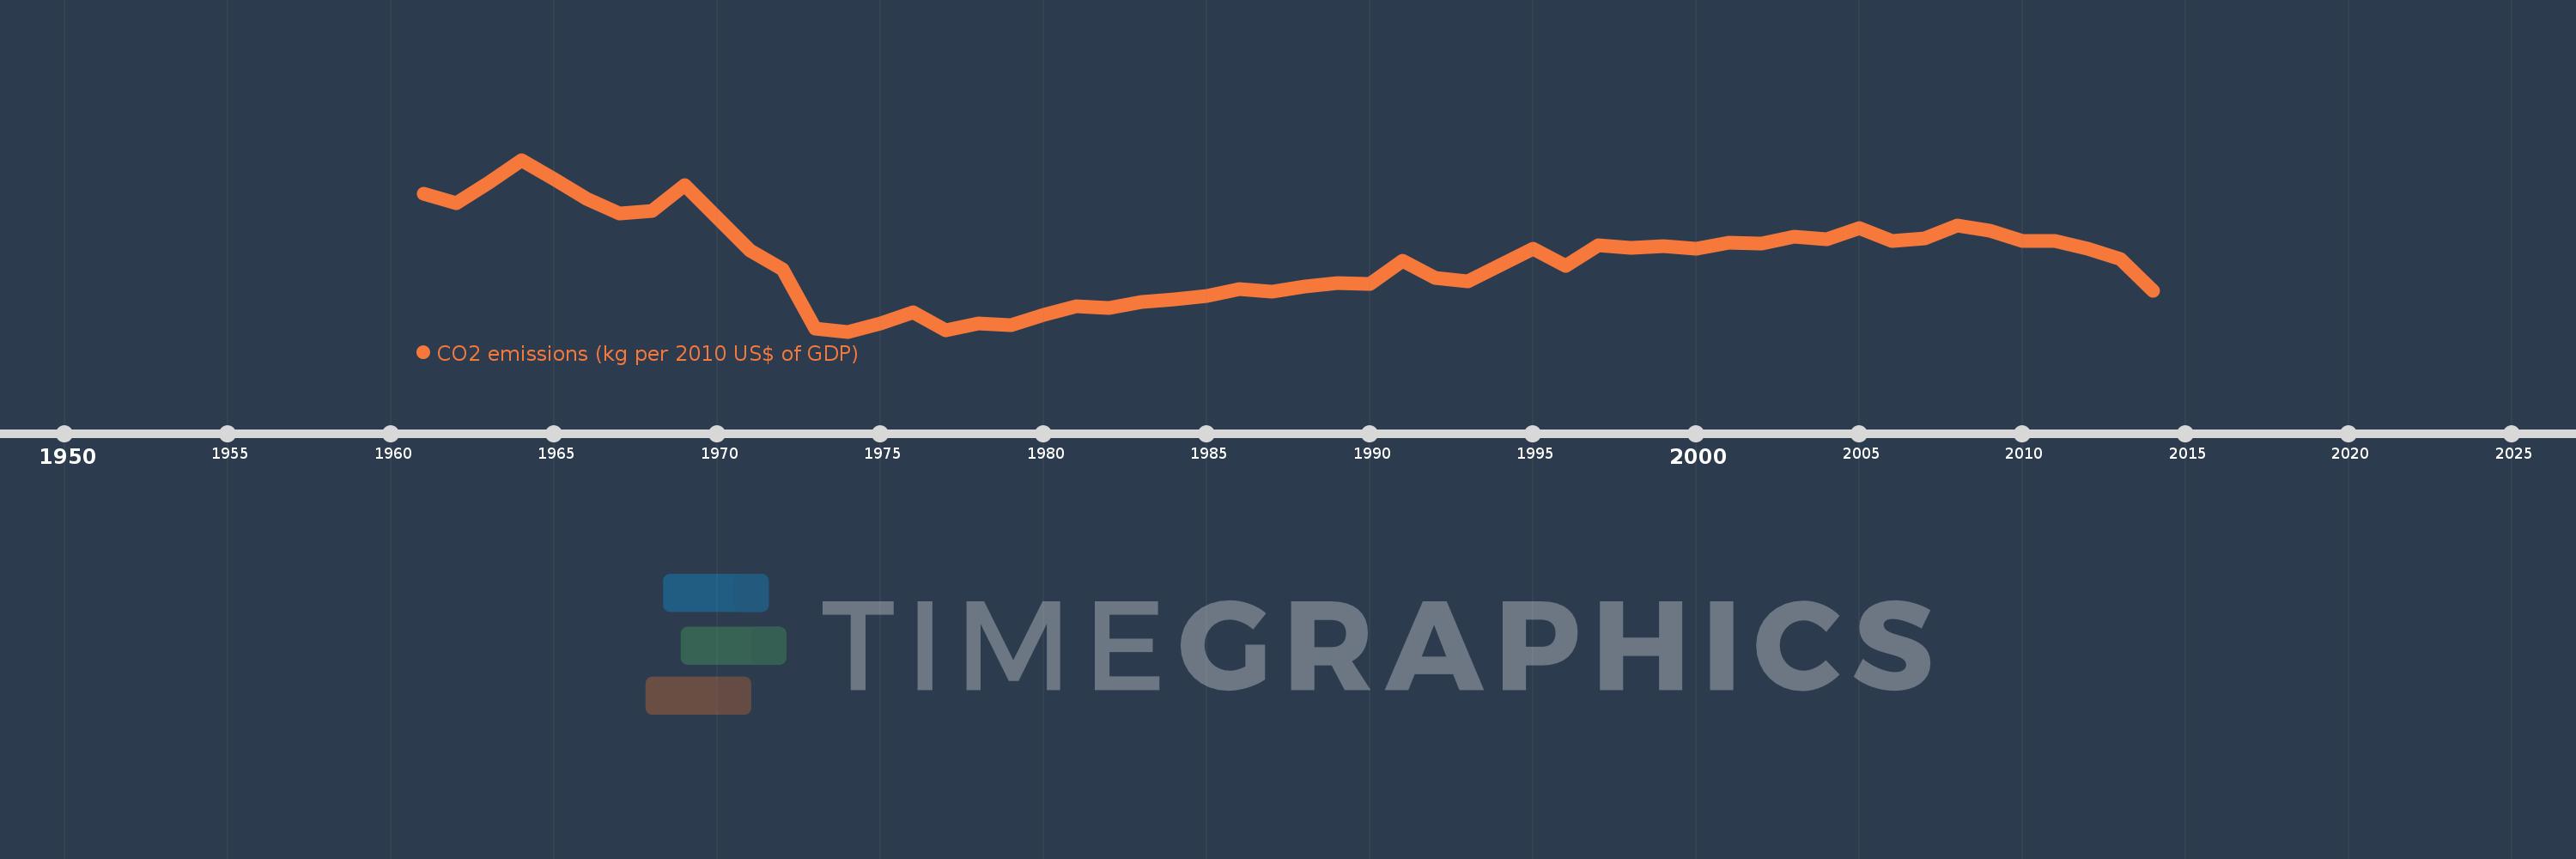
CO2 emissions (kg per 2010 US$ of GDP)
2014,2013,2012,2011,2010,2009,2008,2007,2006,2005,2004,2003,2002,2001,2000,1999,1998,1997,1996,1995,1994,1993,1992,1991,1990,1989,1988,1987,1986,1985,1984,1983,1982,1981,1980,1979,1978,1977,1976,1975,1974,1973,1972,1971,1970,1969,1968,1967,1966,1965,1964,1963,1962,1961
This statistics in other country:
AfghanistanAlbaniaAlgeriaAndorraAngolaAntigua and BarbudaArab WorldArgentinaArmeniaArubaAustraliaAustriaAzerbaijanBahamas, TheBahrainBangladeshBarbadosBelarusBelgiumBelizeBeninBermudaBhutanBoliviaBosnia and HerzegovinaBotswanaBrazilBrunei DarussalamBulgariaBurkina FasoBurundiCabo VerdeCambodiaCameroonCanadaCaribbean small statesCentral African RepublicCentral Europe and the BalticsChadChileChinaColombiaComorosCongo, Dem. Rep.Congo, Rep.Costa RicaCote d'IvoireCroatiaCubaCyprusCzech RepublicDenmarkDjiboutiDominicaDominican RepublicEarly-demographic dividendEast Asia & PacificEast Asia & Pacific (excluding high income)East Asia & Pacific (IDA & IBRD countries)EcuadorEgypt, Arab Rep.El SalvadorEquatorial GuineaEritreaEstoniaEthiopiaEuro areaEurope & Central AsiaEurope & Central Asia (excluding high income)Europe & Central Asia (IDA & IBRD countries)European UnionFaroe IslandsFijiFinlandFragile and conflict affected situationsFranceGabonGambia, TheGeorgiaGermanyGhanaGreeceGreenlandGrenadaGuatemalaGuineaGuinea-BissauGuyanaHaitiHeavily indebted poor countries (HIPC)High incomeHondurasHong Kong SAR, ChinaHungaryIBRD onlyIcelandIDA & IBRD totalIDA blendIDA onlyIDA totalIndiaIndonesiaIran, Islamic Rep.IraqIrelandIsraelItalyJamaicaJapanJordanKazakhstanKenyaKiribatiKorea, Rep.KuwaitKyrgyz RepublicLao PDRLate-demographic dividendLatin America & Caribbean Latin America & Caribbean (excluding high income)Latin America & the Caribbean (IDA & IBRD countries)LatviaLeast developed countries: UN classificationLebanonLesothoLiberiaLibyaLiechtensteinLithuaniaLow & middle incomeLow incomeLower middle incomeLuxembourgMacao SAR, ChinaMacedonia, FYRMadagascarMalawiMalaysiaMaldivesMaliMaltaMarshall IslandsMauritaniaMauritiusMexicoMicronesia, Fed. Sts.Middle East & North AfricaMiddle East & North Africa (excluding high income)Middle East & North Africa (IDA & IBRD countries)Middle incomeMoldovaMongoliaMontenegroMoroccoMozambiqueMyanmarNamibiaNauruNepalNetherlandsNew ZealandNicaraguaNigerNigeriaNorth AmericaNorwayOECD membersOmanOther small statesPacific island small statesPakistanPalauPanamaPapua New GuineaParaguayPeruPhilippinesPolandPortugalPost-demographic dividendPre-demographic dividendQatarRomaniaRussian FederationRwandaSamoaSao Tome and PrincipeSaudi ArabiaSenegalSerbiaSeychellesSierra LeoneSingaporeSlovak RepublicSloveniaSmall statesSolomon IslandsSouth AfricaSouth AsiaSouth Asia (IDA & IBRD)South SudanSpainSri LankaSt. Kitts and NevisSt. LuciaSt. Vincent and the GrenadinesSub-Saharan Africa Sub-Saharan Africa (excluding high income)Sub-Saharan Africa (IDA & IBRD countries)SudanSurinameSwazilandSwedenSwitzerlandTajikistanTanzaniaThailandTimor-LesteTogoTongaTrinidad and TobagoTunisiaTurkeyTurkmenistanUgandaUkraineUnited Arab EmiratesUnited KingdomUnited StatesUpper middle incomeUruguayUzbekistanVanuatuVenezuela, RBVietnamWest Bank and GazaWorldYemen, Rep.ZambiaZimbabwe Timeline:
This timeline shows a graph from 1961 to 2014 of Pakistan. No data until 1960. Number of actual observations by date: 54.
Source name:
World Development Indicators
Source organization:
Carbon Dioxide Information Analysis Center, Environmental Sciences Division, Oak Ridge National Laboratory, Tennessee, United States.
Categories, topics:
Climate Change, Environment
Last updated:
apr 23, 2017
Indicators value changes by year
At the date of observation
Value
Absolute change
Change from previous value
jan 1, 1961
1.034
+1.034
0.0%
jan 1, 1962
1.011
-0.024
-2.3%
jan 1, 1963
1.063
+0.052
5.17%
jan 1, 1964
1.124
+0.061
5.77%
jan 1, 1965
1.074
-0.05
-4.42%
jan 1, 1966
1.021
-0.053
-4.97%
jan 1, 1967
0.982
-0.039
-3.81%
jan 1, 1968
0.989
+0.007
0.7%
jan 1, 1969
1.058
+0.069
6.93%
jan 1, 1970
0.972
-0.085
-8.07%
jan 1, 1971
0.886
-0.087
-8.91%
jan 1, 1972
0.836
-0.05
-5.63%
jan 1, 1973
0.68
-0.156
-18.63%
jan 1, 1974
0.672
-0.008
-1.13%
jan 1, 1975
0.694
+0.022
3.24%
jan 1, 1976
0.722
+0.028
4.03%
jan 1, 1977
0.675
-0.047
-6.47%
jan 1, 1978
0.694
+0.018
2.74%
jan 1, 1979
0.688
-0.006
-0.81%
jan 1, 1980
0.717
+0.029
4.17%
jan 1, 1981
0.738
+0.021
2.99%
jan 1, 1982
0.734
-0.004
-0.6%
jan 1, 1983
0.749
+0.015
2.01%
jan 1, 1984
0.756
+0.007
0.96%
jan 1, 1985
0.765
+0.009
1.21%
jan 1, 1986
0.783
+0.018
2.31%
jan 1, 1987
0.778
-0.005
-0.64%
jan 1, 1988
0.791
+0.013
1.69%
jan 1, 1989
0.799
+0.008
1.04%
jan 1, 1990
0.797
-0.002
-0.24%
jan 1, 1991
0.858
+0.061
7.68%
jan 1, 1992
0.813
-0.045
-5.27%
jan 1, 1993
0.805
-0.008
-0.97%
jan 1, 1994
0.848
+0.043
5.32%
jan 1, 1995
0.889
+0.041
4.84%
jan 1, 1996
0.844
-0.046
-5.13%
jan 1, 1997
0.899
+0.056
6.63%
jan 1, 1998
0.893
-0.007
-0.73%
jan 1, 1999
0.898
+0.005
0.55%
jan 1, 2000
0.89
-0.008
-0.84%
jan 1, 2001
0.906
+0.015
1.71%
jan 1, 2002
0.903
-0.002
-0.26%
jan 1, 2003
0.922
+0.019
2.07%
jan 1, 2004
0.916
-0.006
-0.6%
jan 1, 2005
0.945
+0.028
3.09%
jan 1, 2006
0.911
-0.034
-3.57%
jan 1, 2007
0.917
+0.006
0.69%
jan 1, 2008
0.952
+0.035
3.76%
jan 1, 2009
0.937
-0.015
-1.56%
jan 1, 2010
0.91
-0.027
-2.9%
jan 1, 2011
0.91
+0.0
0.0%
jan 1, 2012
0.889
-0.021
-2.31%
jan 1, 2013
0.864
-0.025
-2.76%
jan 1, 2014
0.779
-0.086
-9.9%
Ranking of countries by current statistics by years


Comments: