29
/
en
AIzaSyAYiBZKx7MnpbEhh9jyipgxe19OcubqV5w
April 1, 2024
38796
IDA only
IDX
false
2
1
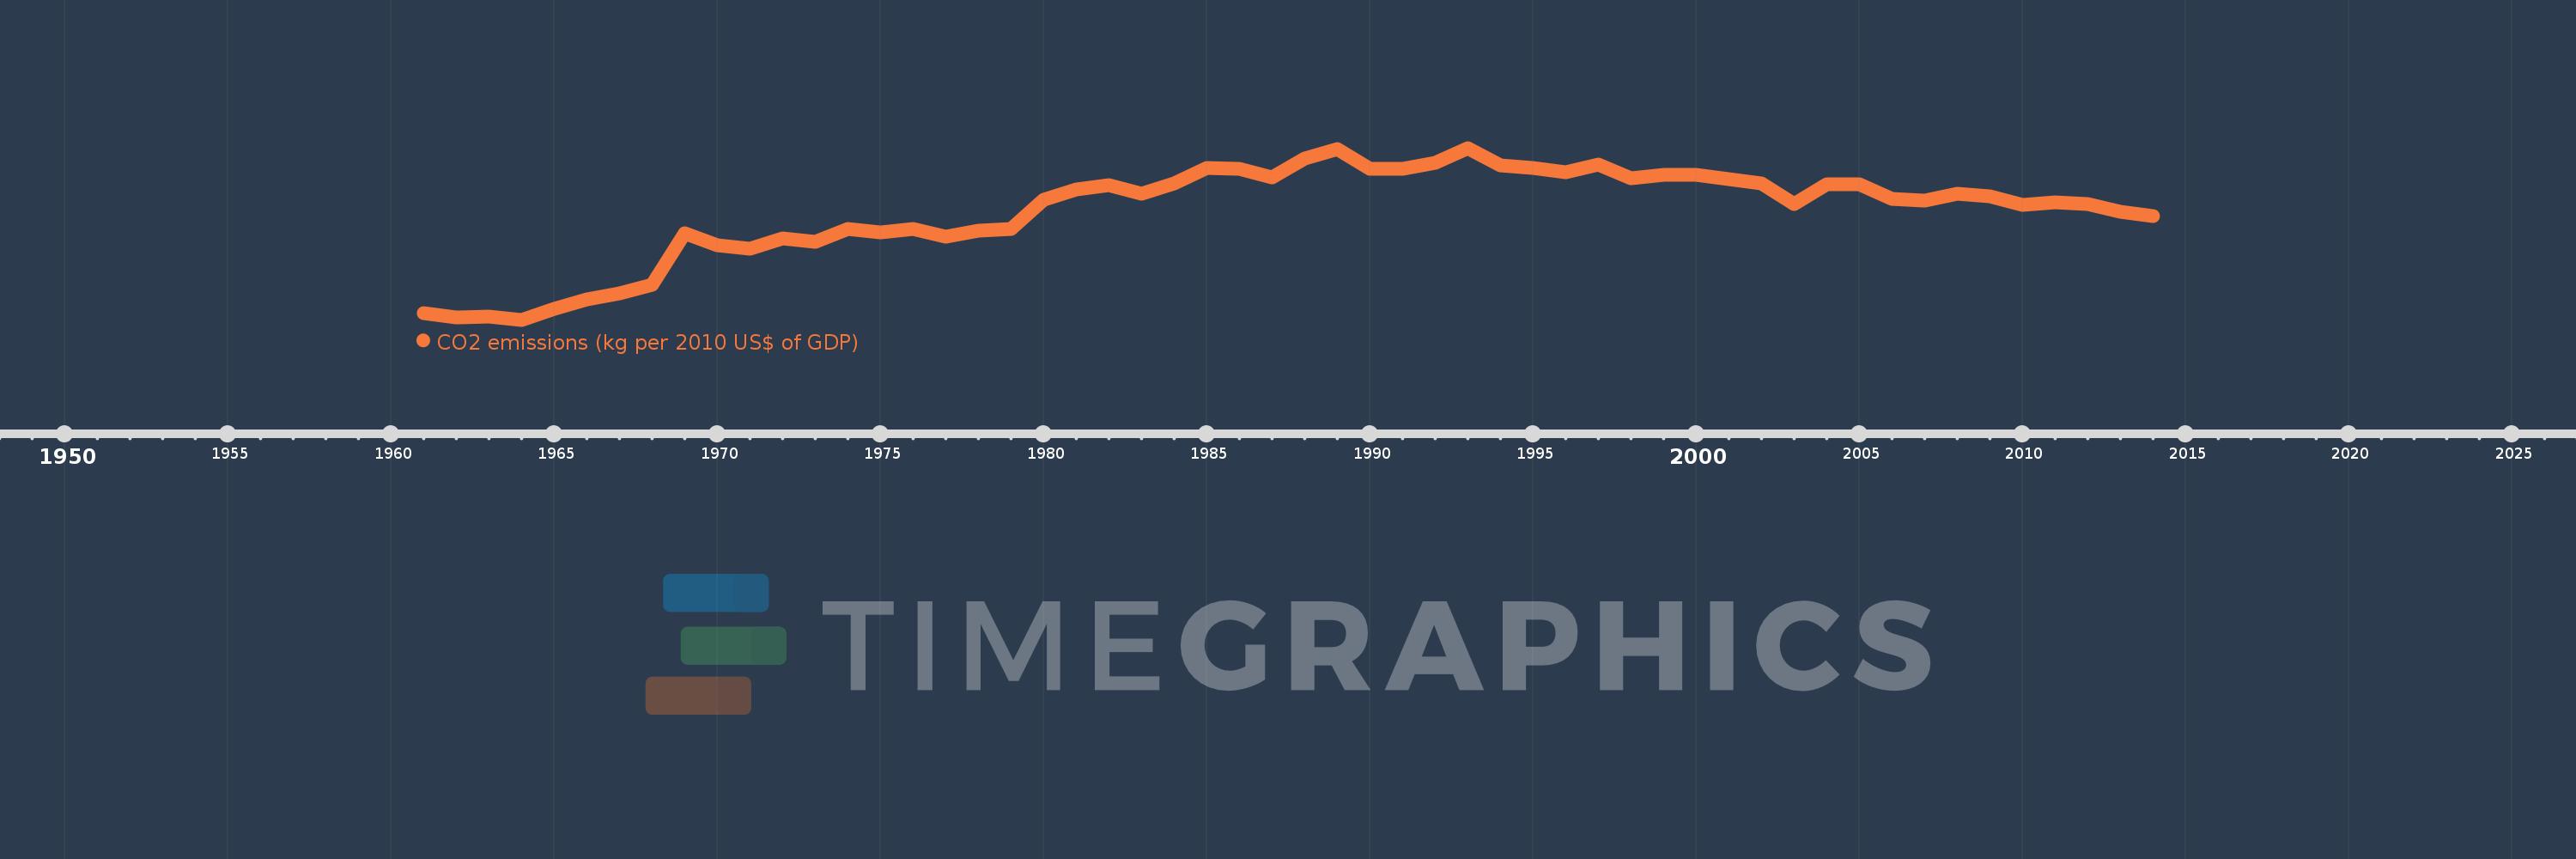
CO2 emissions (kg per 2010 US$ of GDP)
2014,2013,2012,2011,2010,2009,2008,2007,2006,2005,2004,2003,2002,2001,2000,1999,1998,1997,1996,1995,1994,1993,1992,1991,1990,1989,1988,1987,1986,1985,1984,1983,1982,1981,1980,1979,1978,1977,1976,1975,1974,1973,1972,1971,1970,1969,1968,1967,1966,1965,1964,1963,1962,1961
This statistics in other country:
AfghanistanAlbaniaAlgeriaAndorraAngolaAntigua and BarbudaArab WorldArgentinaArmeniaArubaAustraliaAustriaAzerbaijanBahamas, TheBahrainBangladeshBarbadosBelarusBelgiumBelizeBeninBermudaBhutanBoliviaBosnia and HerzegovinaBotswanaBrazilBrunei DarussalamBulgariaBurkina FasoBurundiCabo VerdeCambodiaCameroonCanadaCaribbean small statesCentral African RepublicCentral Europe and the BalticsChadChileChinaColombiaComorosCongo, Dem. Rep.Congo, Rep.Costa RicaCote d'IvoireCroatiaCubaCyprusCzech RepublicDenmarkDjiboutiDominicaDominican RepublicEarly-demographic dividendEast Asia & PacificEast Asia & Pacific (excluding high income)East Asia & Pacific (IDA & IBRD countries)EcuadorEgypt, Arab Rep.El SalvadorEquatorial GuineaEritreaEstoniaEthiopiaEuro areaEurope & Central AsiaEurope & Central Asia (excluding high income)Europe & Central Asia (IDA & IBRD countries)European UnionFaroe IslandsFijiFinlandFragile and conflict affected situationsFranceGabonGambia, TheGeorgiaGermanyGhanaGreeceGreenlandGrenadaGuatemalaGuineaGuinea-BissauGuyanaHaitiHeavily indebted poor countries (HIPC)High incomeHondurasHong Kong SAR, ChinaHungaryIBRD onlyIcelandIDA & IBRD totalIDA blendIDA onlyIDA totalIndiaIndonesiaIran, Islamic Rep.IraqIrelandIsraelItalyJamaicaJapanJordanKazakhstanKenyaKiribatiKorea, Rep.KuwaitKyrgyz RepublicLao PDRLate-demographic dividendLatin America & Caribbean Latin America & Caribbean (excluding high income)Latin America & the Caribbean (IDA & IBRD countries)LatviaLeast developed countries: UN classificationLebanonLesothoLiberiaLibyaLiechtensteinLithuaniaLow & middle incomeLow incomeLower middle incomeLuxembourgMacao SAR, ChinaMacedonia, FYRMadagascarMalawiMalaysiaMaldivesMaliMaltaMarshall IslandsMauritaniaMauritiusMexicoMicronesia, Fed. Sts.Middle East & North AfricaMiddle East & North Africa (excluding high income)Middle East & North Africa (IDA & IBRD countries)Middle incomeMoldovaMongoliaMontenegroMoroccoMozambiqueMyanmarNamibiaNauruNepalNetherlandsNew ZealandNicaraguaNigerNigeriaNorth AmericaNorwayOECD membersOmanOther small statesPacific island small statesPakistanPalauPanamaPapua New GuineaParaguayPeruPhilippinesPolandPortugalPost-demographic dividendPre-demographic dividendQatarRomaniaRussian FederationRwandaSamoaSao Tome and PrincipeSaudi ArabiaSenegalSerbiaSeychellesSierra LeoneSingaporeSlovak RepublicSloveniaSmall statesSolomon IslandsSouth AfricaSouth AsiaSouth Asia (IDA & IBRD)South SudanSpainSri LankaSt. Kitts and NevisSt. LuciaSt. Vincent and the GrenadinesSub-Saharan Africa Sub-Saharan Africa (excluding high income)Sub-Saharan Africa (IDA & IBRD countries)SudanSurinameSwazilandSwedenSwitzerlandTajikistanTanzaniaThailandTimor-LesteTogoTongaTrinidad and TobagoTunisiaTurkeyTurkmenistanUgandaUkraineUnited Arab EmiratesUnited KingdomUnited StatesUpper middle incomeUruguayUzbekistanVanuatuVenezuela, RBVietnamWest Bank and GazaWorldYemen, Rep.ZambiaZimbabwe Timeline:
This timeline shows a graph from 1961 to 2014 of IDA only. No data until 1960. Number of actual observations by date: 54.
Source name:
World Development Indicators
Source organization:
Carbon Dioxide Information Analysis Center, Environmental Sciences Division, Oak Ridge National Laboratory, Tennessee, United States.
Categories, topics:
Climate Change, Environment
Last updated:
apr 23, 2017
Indicators value changes by year
At the date of observation
Value
Absolute change
Change from previous value
jan 1, 1961
0.262
+0.262
0.0%
jan 1, 1962
0.256
-0.006
-2.25%
jan 1, 1963
0.257
+0.001
0.3%
jan 1, 1964
0.253
-0.004
-1.49%
jan 1, 1965
0.267
+0.013
5.27%
jan 1, 1966
0.28
+0.013
5.05%
jan 1, 1967
0.288
+0.007
2.65%
jan 1, 1968
0.299
+0.012
4.12%
jan 1, 1969
0.366
+0.067
22.26%
jan 1, 1970
0.35
-0.016
-4.46%
jan 1, 1971
0.346
-0.004
-1.07%
jan 1, 1972
0.359
+0.013
3.78%
jan 1, 1973
0.355
-0.004
-1.08%
jan 1, 1974
0.372
+0.016
4.62%
jan 1, 1975
0.367
-0.005
-1.35%
jan 1, 1976
0.372
+0.005
1.33%
jan 1, 1977
0.362
-0.009
-2.48%
jan 1, 1978
0.37
+0.008
2.14%
jan 1, 1979
0.372
+0.002
0.42%
jan 1, 1980
0.41
+0.038
10.29%
jan 1, 1981
0.424
+0.014
3.51%
jan 1, 1982
0.429
+0.005
1.12%
jan 1, 1983
0.418
-0.011
-2.6%
jan 1, 1984
0.432
+0.014
3.31%
jan 1, 1985
0.452
+0.02
4.69%
jan 1, 1986
0.451
-0.001
-0.22%
jan 1, 1987
0.439
-0.012
-2.75%
jan 1, 1988
0.464
+0.025
5.76%
jan 1, 1989
0.476
+0.012
2.61%
jan 1, 1990
0.451
-0.025
-5.19%
jan 1, 1991
0.451
0.0
-0.01%
jan 1, 1992
0.458
+0.007
1.54%
jan 1, 1993
0.478
+0.02
4.42%
jan 1, 1994
0.455
-0.023
-4.85%
jan 1, 1995
0.452
-0.003
-0.61%
jan 1, 1996
0.446
-0.006
-1.41%
jan 1, 1997
0.456
+0.01
2.31%
jan 1, 1998
0.438
-0.019
-4.1%
jan 1, 1999
0.443
+0.006
1.32%
jan 1, 2000
0.443
+0.0
0.02%
jan 1, 2001
0.437
-0.006
-1.34%
jan 1, 2002
0.431
-0.006
-1.39%
jan 1, 2003
0.404
-0.027
-6.26%
jan 1, 2004
0.43
+0.026
6.44%
jan 1, 2005
0.43
0.0
-0.09%
jan 1, 2006
0.411
-0.019
-4.48%
jan 1, 2007
0.409
-0.001
-0.35%
jan 1, 2008
0.418
+0.009
2.2%
jan 1, 2009
0.415
-0.003
-0.83%
jan 1, 2010
0.403
-0.012
-2.81%
jan 1, 2011
0.407
+0.004
0.97%
jan 1, 2012
0.404
-0.003
-0.67%
jan 1, 2013
0.394
-0.01
-2.46%
jan 1, 2014
0.389
-0.005
-1.36%
Ranking of countries by current statistics by years


Comments: