29
/
en
AIzaSyAYiBZKx7MnpbEhh9jyipgxe19OcubqV5w
April 1, 2024
245324
South Africa
ZAF
true
2
1
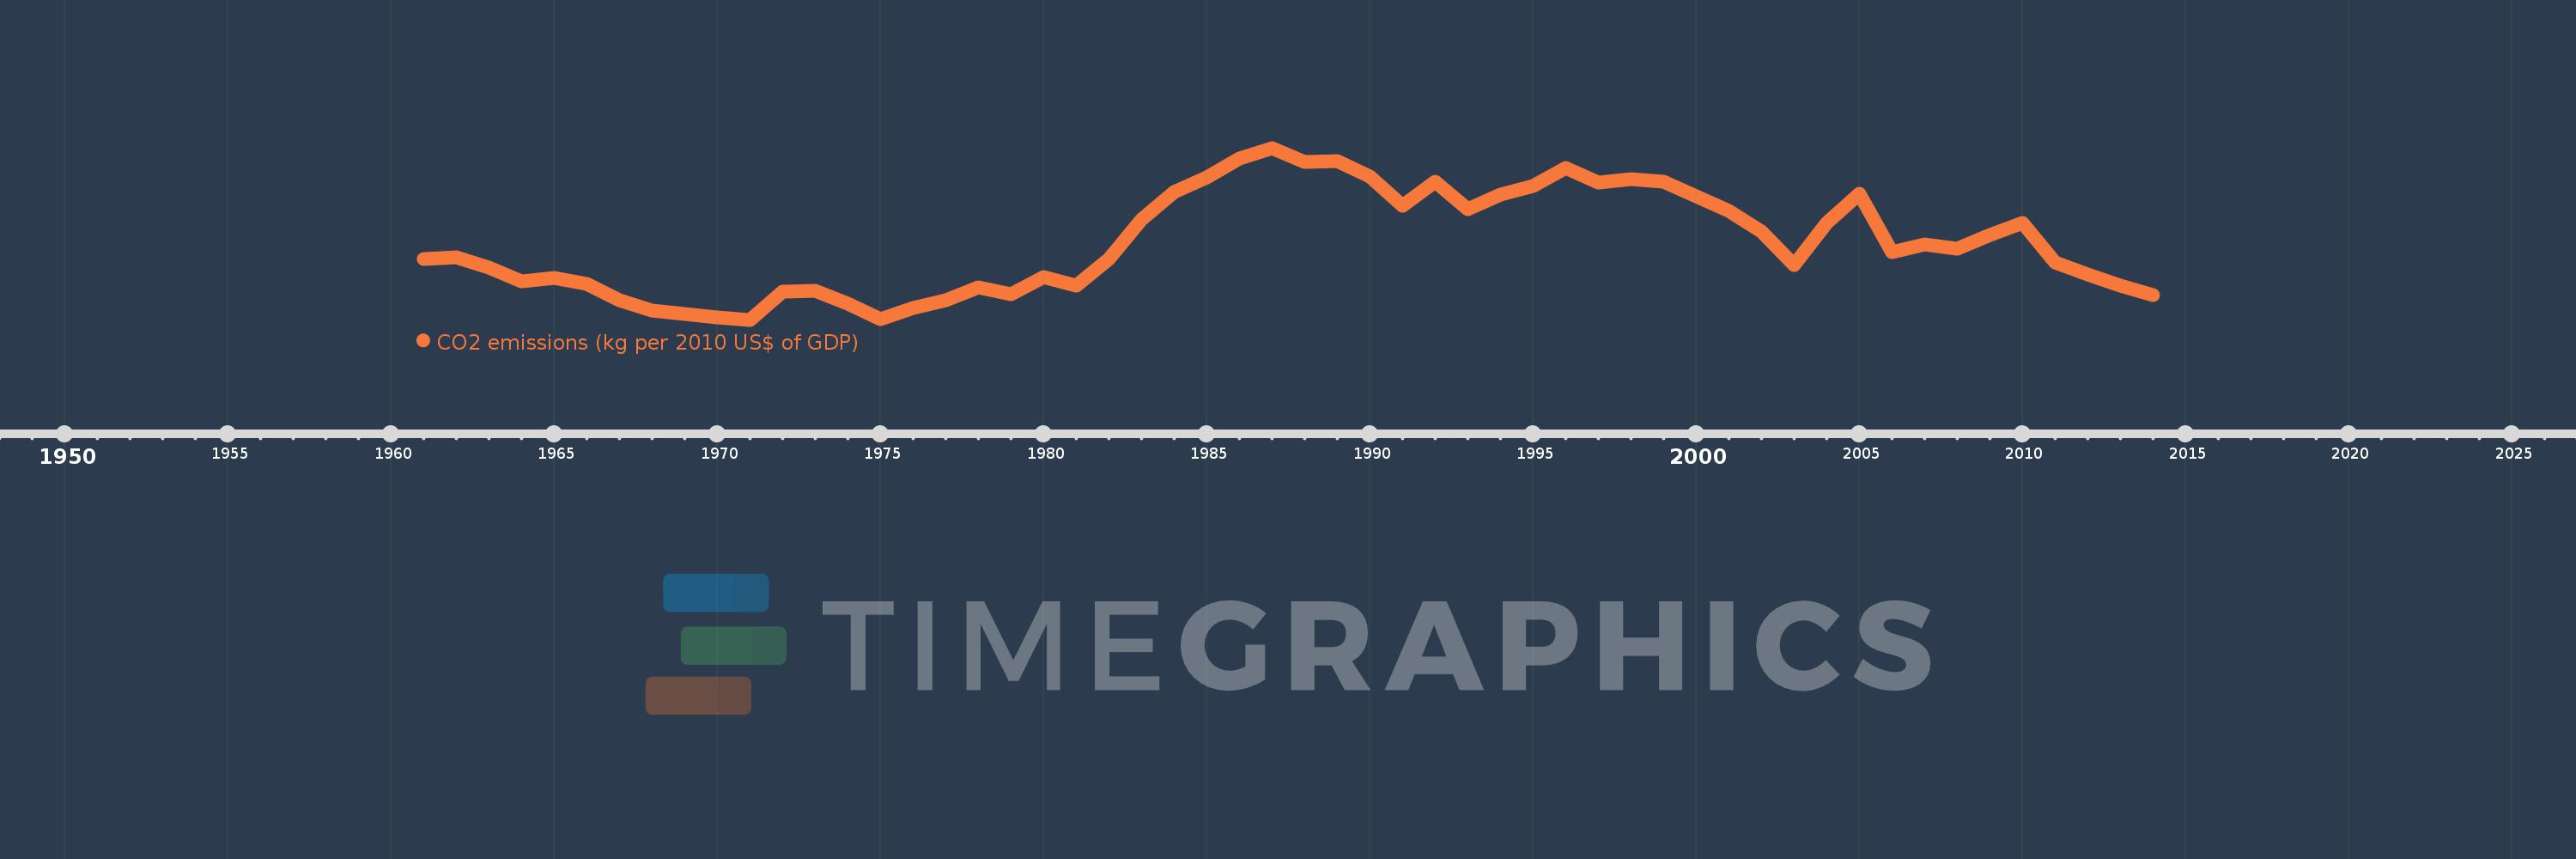
CO2 emissions (kg per 2010 US$ of GDP)
2014,2013,2012,2011,2010,2009,2008,2007,2006,2005,2004,2003,2002,2001,2000,1999,1998,1997,1996,1995,1994,1993,1992,1991,1990,1989,1988,1987,1986,1985,1984,1983,1982,1981,1980,1979,1978,1977,1976,1975,1974,1973,1972,1971,1970,1969,1968,1967,1966,1965,1964,1963,1962,1961
This statistics in other country:
AfghanistanAlbaniaAlgeriaAndorraAngolaAntigua and BarbudaArab WorldArgentinaArmeniaArubaAustraliaAustriaAzerbaijanBahamas, TheBahrainBangladeshBarbadosBelarusBelgiumBelizeBeninBermudaBhutanBoliviaBosnia and HerzegovinaBotswanaBrazilBrunei DarussalamBulgariaBurkina FasoBurundiCabo VerdeCambodiaCameroonCanadaCaribbean small statesCentral African RepublicCentral Europe and the BalticsChadChileChinaColombiaComorosCongo, Dem. Rep.Congo, Rep.Costa RicaCote d'IvoireCroatiaCubaCyprusCzech RepublicDenmarkDjiboutiDominicaDominican RepublicEarly-demographic dividendEast Asia & PacificEast Asia & Pacific (excluding high income)East Asia & Pacific (IDA & IBRD countries)EcuadorEgypt, Arab Rep.El SalvadorEquatorial GuineaEritreaEstoniaEthiopiaEuro areaEurope & Central AsiaEurope & Central Asia (excluding high income)Europe & Central Asia (IDA & IBRD countries)European UnionFaroe IslandsFijiFinlandFragile and conflict affected situationsFranceGabonGambia, TheGeorgiaGermanyGhanaGreeceGreenlandGrenadaGuatemalaGuineaGuinea-BissauGuyanaHaitiHeavily indebted poor countries (HIPC)High incomeHondurasHong Kong SAR, ChinaHungaryIBRD onlyIcelandIDA & IBRD totalIDA blendIDA onlyIDA totalIndiaIndonesiaIran, Islamic Rep.IraqIrelandIsraelItalyJamaicaJapanJordanKazakhstanKenyaKiribatiKorea, Rep.KuwaitKyrgyz RepublicLao PDRLate-demographic dividendLatin America & Caribbean Latin America & Caribbean (excluding high income)Latin America & the Caribbean (IDA & IBRD countries)LatviaLeast developed countries: UN classificationLebanonLesothoLiberiaLibyaLiechtensteinLithuaniaLow & middle incomeLow incomeLower middle incomeLuxembourgMacao SAR, ChinaMacedonia, FYRMadagascarMalawiMalaysiaMaldivesMaliMaltaMarshall IslandsMauritaniaMauritiusMexicoMicronesia, Fed. Sts.Middle East & North AfricaMiddle East & North Africa (excluding high income)Middle East & North Africa (IDA & IBRD countries)Middle incomeMoldovaMongoliaMontenegroMoroccoMozambiqueMyanmarNamibiaNauruNepalNetherlandsNew ZealandNicaraguaNigerNigeriaNorth AmericaNorwayOECD membersOmanOther small statesPacific island small statesPakistanPalauPanamaPapua New GuineaParaguayPeruPhilippinesPolandPortugalPost-demographic dividendPre-demographic dividendQatarRomaniaRussian FederationRwandaSamoaSao Tome and PrincipeSaudi ArabiaSenegalSerbiaSeychellesSierra LeoneSingaporeSlovak RepublicSloveniaSmall statesSolomon IslandsSouth AfricaSouth AsiaSouth Asia (IDA & IBRD)South SudanSpainSri LankaSt. Kitts and NevisSt. LuciaSt. Vincent and the GrenadinesSub-Saharan Africa Sub-Saharan Africa (excluding high income)Sub-Saharan Africa (IDA & IBRD countries)SudanSurinameSwazilandSwedenSwitzerlandTajikistanTanzaniaThailandTimor-LesteTogoTongaTrinidad and TobagoTunisiaTurkeyTurkmenistanUgandaUkraineUnited Arab EmiratesUnited KingdomUnited StatesUpper middle incomeUruguayUzbekistanVanuatuVenezuela, RBVietnamWest Bank and GazaWorldYemen, Rep.ZambiaZimbabwe Timeline:
This timeline shows a graph from 1961 to 2014 of South Africa. No data until 1960. Number of actual observations by date: 54.
Source name:
World Development Indicators
Source organization:
Carbon Dioxide Information Analysis Center, Environmental Sciences Division, Oak Ridge National Laboratory, Tennessee, United States.
Categories, topics:
Climate Change, Environment
Last updated:
apr 23, 2017
Indicators value changes by year
At the date of observation
Value
Absolute change
Change from previous value
jan 1, 1961
1.271
+1.271
0.0%
jan 1, 1962
1.277
+0.006
0.5%
jan 1, 1963
1.245
-0.032
-2.54%
jan 1, 1964
1.204
-0.041
-3.29%
jan 1, 1965
1.215
+0.011
0.94%
jan 1, 1966
1.196
-0.019
-1.57%
jan 1, 1967
1.146
-0.05
-4.18%
jan 1, 1968
1.115
-0.031
-2.69%
jan 1, 1969
1.104
-0.011
-0.98%
jan 1, 1970
1.094
-0.01
-0.91%
jan 1, 1971
1.087
-0.008
-0.69%
jan 1, 1972
1.173
+0.086
7.94%
jan 1, 1973
1.175
+0.003
0.21%
jan 1, 1974
1.136
-0.04
-3.37%
jan 1, 1975
1.09
-0.046
-4.02%
jan 1, 1976
1.123
+0.033
3.04%
jan 1, 1977
1.146
+0.022
1.98%
jan 1, 1978
1.187
+0.042
3.64%
jan 1, 1979
1.165
-0.022
-1.88%
jan 1, 1980
1.216
+0.051
4.36%
jan 1, 1981
1.19
-0.026
-2.12%
jan 1, 1982
1.272
+0.082
6.92%
jan 1, 1983
1.393
+0.121
9.5%
jan 1, 1984
1.477
+0.084
6.05%
jan 1, 1985
1.52
+0.042
2.87%
jan 1, 1986
1.579
+0.059
3.87%
jan 1, 1987
1.611
+0.032
2.03%
jan 1, 1988
1.569
-0.042
-2.6%
jan 1, 1989
1.57
+0.001
0.06%
jan 1, 1990
1.524
-0.045
-2.89%
jan 1, 1991
1.434
-0.091
-5.95%
jan 1, 1992
1.507
+0.073
5.08%
jan 1, 1993
1.425
-0.082
-5.43%
jan 1, 1994
1.468
+0.043
3.04%
jan 1, 1995
1.496
+0.027
1.87%
jan 1, 1996
1.549
+0.053
3.54%
jan 1, 1997
1.506
-0.043
-2.77%
jan 1, 1998
1.517
+0.012
0.78%
jan 1, 1999
1.509
-0.008
-0.53%
jan 1, 2000
1.464
-0.045
-2.99%
jan 1, 2001
1.418
-0.046
-3.15%
jan 1, 2002
1.357
-0.061
-4.33%
jan 1, 2003
1.254
-0.103
-7.56%
jan 1, 2004
1.381
+0.127
10.16%
jan 1, 2005
1.471
+0.089
6.46%
jan 1, 2006
1.294
-0.177
-12.03%
jan 1, 2007
1.316
+0.023
1.75%
jan 1, 2008
1.304
-0.012
-0.95%
jan 1, 2009
1.345
+0.041
3.16%
jan 1, 2010
1.382
+0.037
2.72%
jan 1, 2011
1.263
-0.118
-8.57%
jan 1, 2012
1.225
-0.038
-2.99%
jan 1, 2013
1.191
-0.034
-2.78%
jan 1, 2014
1.162
-0.029
-2.45%
Ranking of countries by current statistics by years


Comments: