29
/
en
AIzaSyAYiBZKx7MnpbEhh9jyipgxe19OcubqV5w
April 1, 2024
234451
Saudi Arabia
SAU
true
2
1
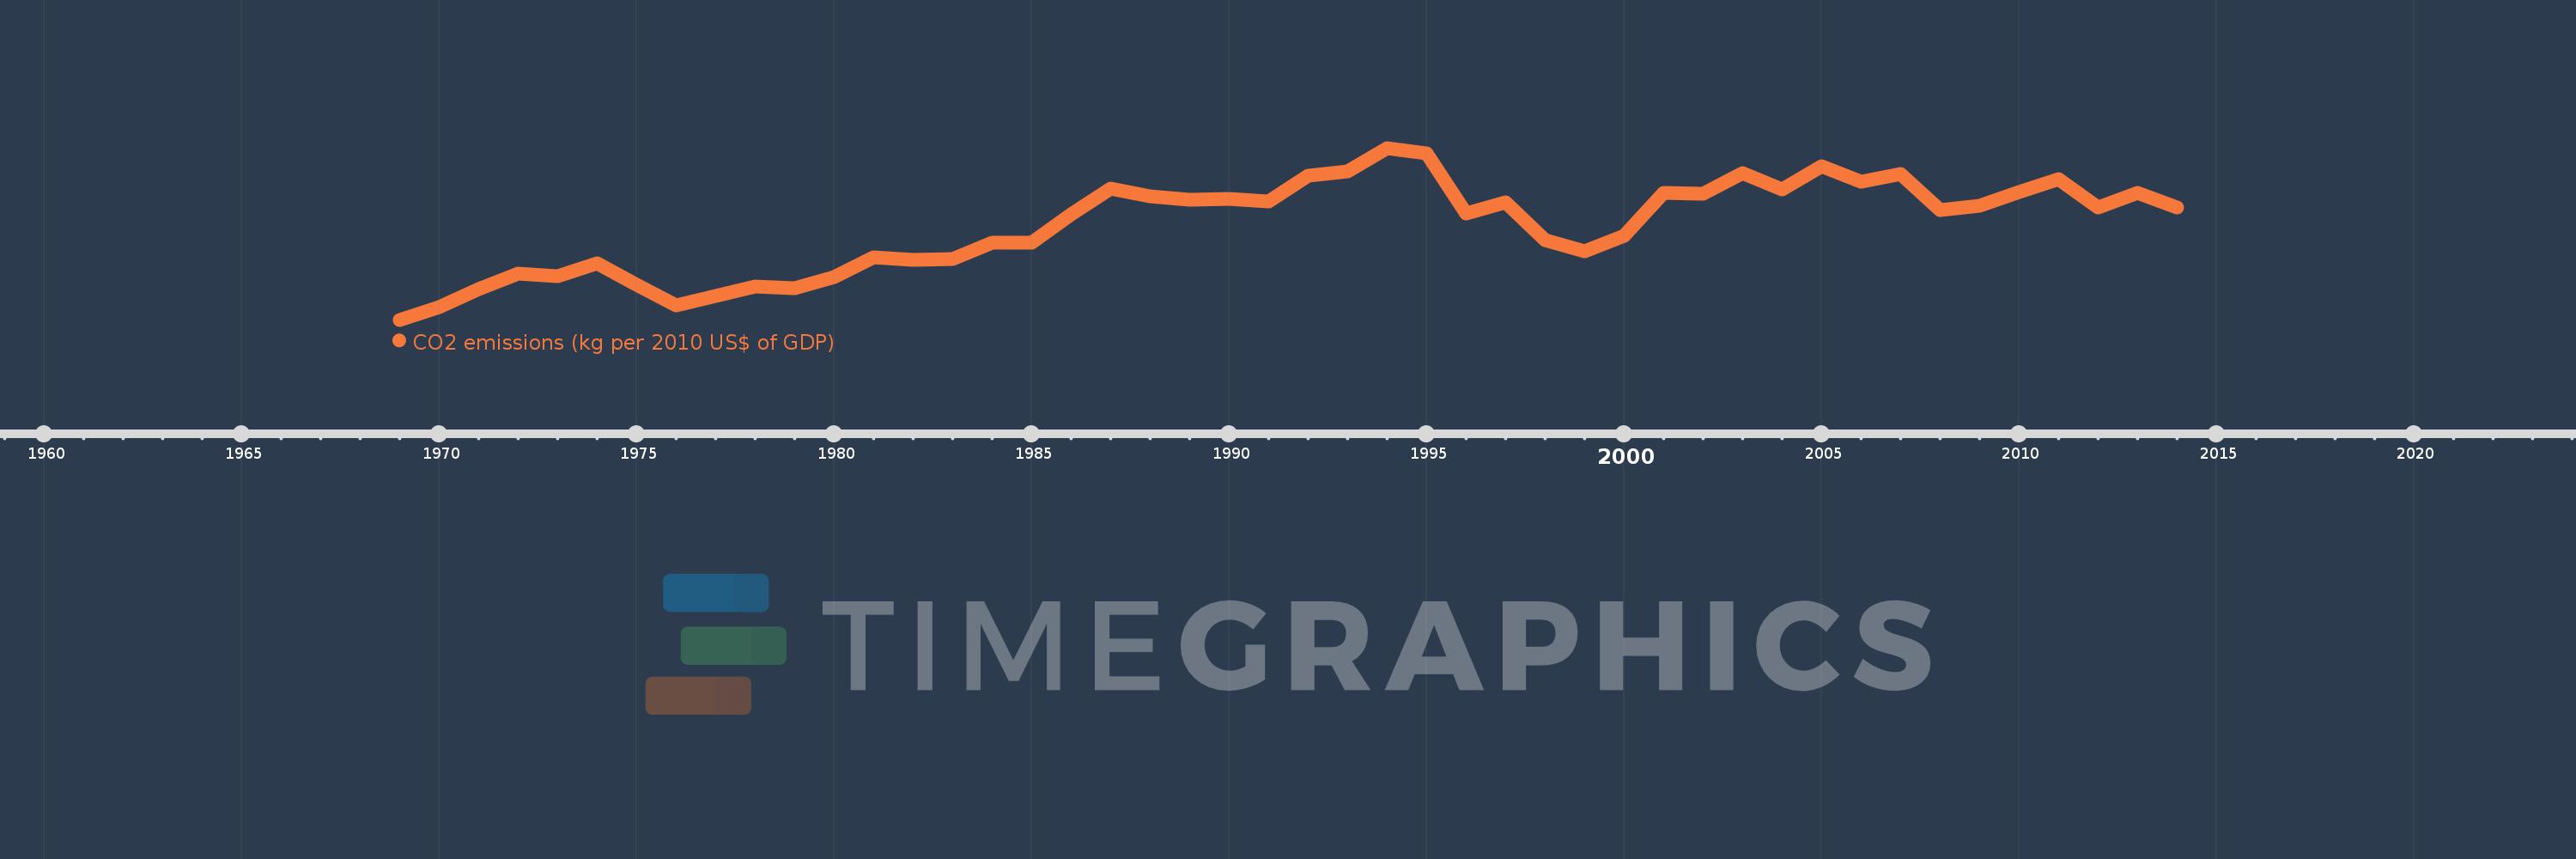
CO2 emissions (kg per 2010 US$ of GDP)
2014,2013,2012,2011,2010,2009,2008,2007,2006,2005,2004,2003,2002,2001,2000,1999,1998,1997,1996,1995,1994,1993,1992,1991,1990,1989,1988,1987,1986,1985,1984,1983,1982,1981,1980,1979,1978,1977,1976,1975,1974,1973,1972,1971,1970,1969
This statistics in other country:
AfghanistanAlbaniaAlgeriaAndorraAngolaAntigua and BarbudaArab WorldArgentinaArmeniaArubaAustraliaAustriaAzerbaijanBahamas, TheBahrainBangladeshBarbadosBelarusBelgiumBelizeBeninBermudaBhutanBoliviaBosnia and HerzegovinaBotswanaBrazilBrunei DarussalamBulgariaBurkina FasoBurundiCabo VerdeCambodiaCameroonCanadaCaribbean small statesCentral African RepublicCentral Europe and the BalticsChadChileChinaColombiaComorosCongo, Dem. Rep.Congo, Rep.Costa RicaCote d'IvoireCroatiaCubaCyprusCzech RepublicDenmarkDjiboutiDominicaDominican RepublicEarly-demographic dividendEast Asia & PacificEast Asia & Pacific (excluding high income)East Asia & Pacific (IDA & IBRD countries)EcuadorEgypt, Arab Rep.El SalvadorEquatorial GuineaEritreaEstoniaEthiopiaEuro areaEurope & Central AsiaEurope & Central Asia (excluding high income)Europe & Central Asia (IDA & IBRD countries)European UnionFaroe IslandsFijiFinlandFragile and conflict affected situationsFranceGabonGambia, TheGeorgiaGermanyGhanaGreeceGreenlandGrenadaGuatemalaGuineaGuinea-BissauGuyanaHaitiHeavily indebted poor countries (HIPC)High incomeHondurasHong Kong SAR, ChinaHungaryIBRD onlyIcelandIDA & IBRD totalIDA blendIDA onlyIDA totalIndiaIndonesiaIran, Islamic Rep.IraqIrelandIsraelItalyJamaicaJapanJordanKazakhstanKenyaKiribatiKorea, Rep.KuwaitKyrgyz RepublicLao PDRLate-demographic dividendLatin America & Caribbean Latin America & Caribbean (excluding high income)Latin America & the Caribbean (IDA & IBRD countries)LatviaLeast developed countries: UN classificationLebanonLesothoLiberiaLibyaLiechtensteinLithuaniaLow & middle incomeLow incomeLower middle incomeLuxembourgMacao SAR, ChinaMacedonia, FYRMadagascarMalawiMalaysiaMaldivesMaliMaltaMarshall IslandsMauritaniaMauritiusMexicoMicronesia, Fed. Sts.Middle East & North AfricaMiddle East & North Africa (excluding high income)Middle East & North Africa (IDA & IBRD countries)Middle incomeMoldovaMongoliaMontenegroMoroccoMozambiqueMyanmarNamibiaNauruNepalNetherlandsNew ZealandNicaraguaNigerNigeriaNorth AmericaNorwayOECD membersOmanOther small statesPacific island small statesPakistanPalauPanamaPapua New GuineaParaguayPeruPhilippinesPolandPortugalPost-demographic dividendPre-demographic dividendQatarRomaniaRussian FederationRwandaSamoaSao Tome and PrincipeSaudi ArabiaSenegalSerbiaSeychellesSierra LeoneSingaporeSlovak RepublicSloveniaSmall statesSolomon IslandsSouth AfricaSouth AsiaSouth Asia (IDA & IBRD)South SudanSpainSri LankaSt. Kitts and NevisSt. LuciaSt. Vincent and the GrenadinesSub-Saharan Africa Sub-Saharan Africa (excluding high income)Sub-Saharan Africa (IDA & IBRD countries)SudanSurinameSwazilandSwedenSwitzerlandTajikistanTanzaniaThailandTimor-LesteTogoTongaTrinidad and TobagoTunisiaTurkeyTurkmenistanUgandaUkraineUnited Arab EmiratesUnited KingdomUnited StatesUpper middle incomeUruguayUzbekistanVanuatuVenezuela, RBVietnamWest Bank and GazaWorldYemen, Rep.ZambiaZimbabwe Timeline:
This timeline shows a graph from 1969 to 2014 of Saudi Arabia. No data until 1968. Number of actual observations by date: 46.
Source name:
World Development Indicators
Source organization:
Carbon Dioxide Information Analysis Center, Environmental Sciences Division, Oak Ridge National Laboratory, Tennessee, United States.
Categories, topics:
Climate Change, Environment
Last updated:
apr 23, 2017
Indicators value changes by year
At the date of observation
Value
Absolute change
Change from previous value
jan 1, 1969
0.379
+0.379
0.0%
jan 1, 1970
0.434
+0.055
14.39%
jan 1, 1971
0.513
+0.079
18.27%
jan 1, 1972
0.579
+0.066
12.96%
jan 1, 1973
0.566
-0.013
-2.28%
jan 1, 1974
0.624
+0.058
10.25%
jan 1, 1975
0.529
-0.095
-15.3%
jan 1, 1976
0.441
-0.088
-16.57%
jan 1, 1977
0.48
+0.039
8.85%
jan 1, 1978
0.523
+0.043
8.87%
jan 1, 1979
0.514
-0.008
-1.6%
jan 1, 1980
0.562
+0.048
9.33%
jan 1, 1981
0.647
+0.085
15.07%
jan 1, 1982
0.639
-0.007
-1.15%
jan 1, 1983
0.643
+0.004
0.57%
jan 1, 1984
0.711
+0.068
10.55%
jan 1, 1985
0.711
0.0
-0.04%
jan 1, 1986
0.834
+0.123
17.34%
jan 1, 1987
0.944
+0.11
13.18%
jan 1, 1988
0.913
-0.031
-3.28%
jan 1, 1989
0.896
-0.017
-1.86%
jan 1, 1990
0.901
+0.005
0.52%
jan 1, 1991
0.889
-0.011
-1.25%
jan 1, 1992
1.001
+0.112
12.61%
jan 1, 1993
1.021
+0.019
1.92%
jan 1, 1994
1.121
+0.101
9.88%
jan 1, 1995
1.097
-0.024
-2.18%
jan 1, 1996
0.837
-0.26
-23.7%
jan 1, 1997
0.887
+0.05
5.94%
jan 1, 1998
0.722
-0.164
-18.54%
jan 1, 1999
0.675
-0.048
-6.61%
jan 1, 2000
0.741
+0.067
9.86%
jan 1, 2001
0.927
+0.186
25.04%
jan 1, 2002
0.922
-0.004
-0.45%
jan 1, 2003
1.012
+0.089
9.68%
jan 1, 2004
0.942
-0.069
-6.87%
jan 1, 2005
1.043
+0.101
10.7%
jan 1, 2006
0.977
-0.066
-6.34%
jan 1, 2007
1.007
+0.03
3.08%
jan 1, 2008
0.851
-0.156
-15.46%
jan 1, 2009
0.871
+0.02
2.31%
jan 1, 2010
0.932
+0.061
7.01%
jan 1, 2011
0.988
+0.056
6.0%
jan 1, 2012
0.864
-0.124
-12.52%
jan 1, 2013
0.927
+0.063
7.26%
jan 1, 2014
0.864
-0.063
-6.83%
Ranking of countries by current statistics by years


Comments: