29
/
en
AIzaSyAYiBZKx7MnpbEhh9jyipgxe19OcubqV5w
April 1, 2024
73711
Austria
AUT
true
2
1
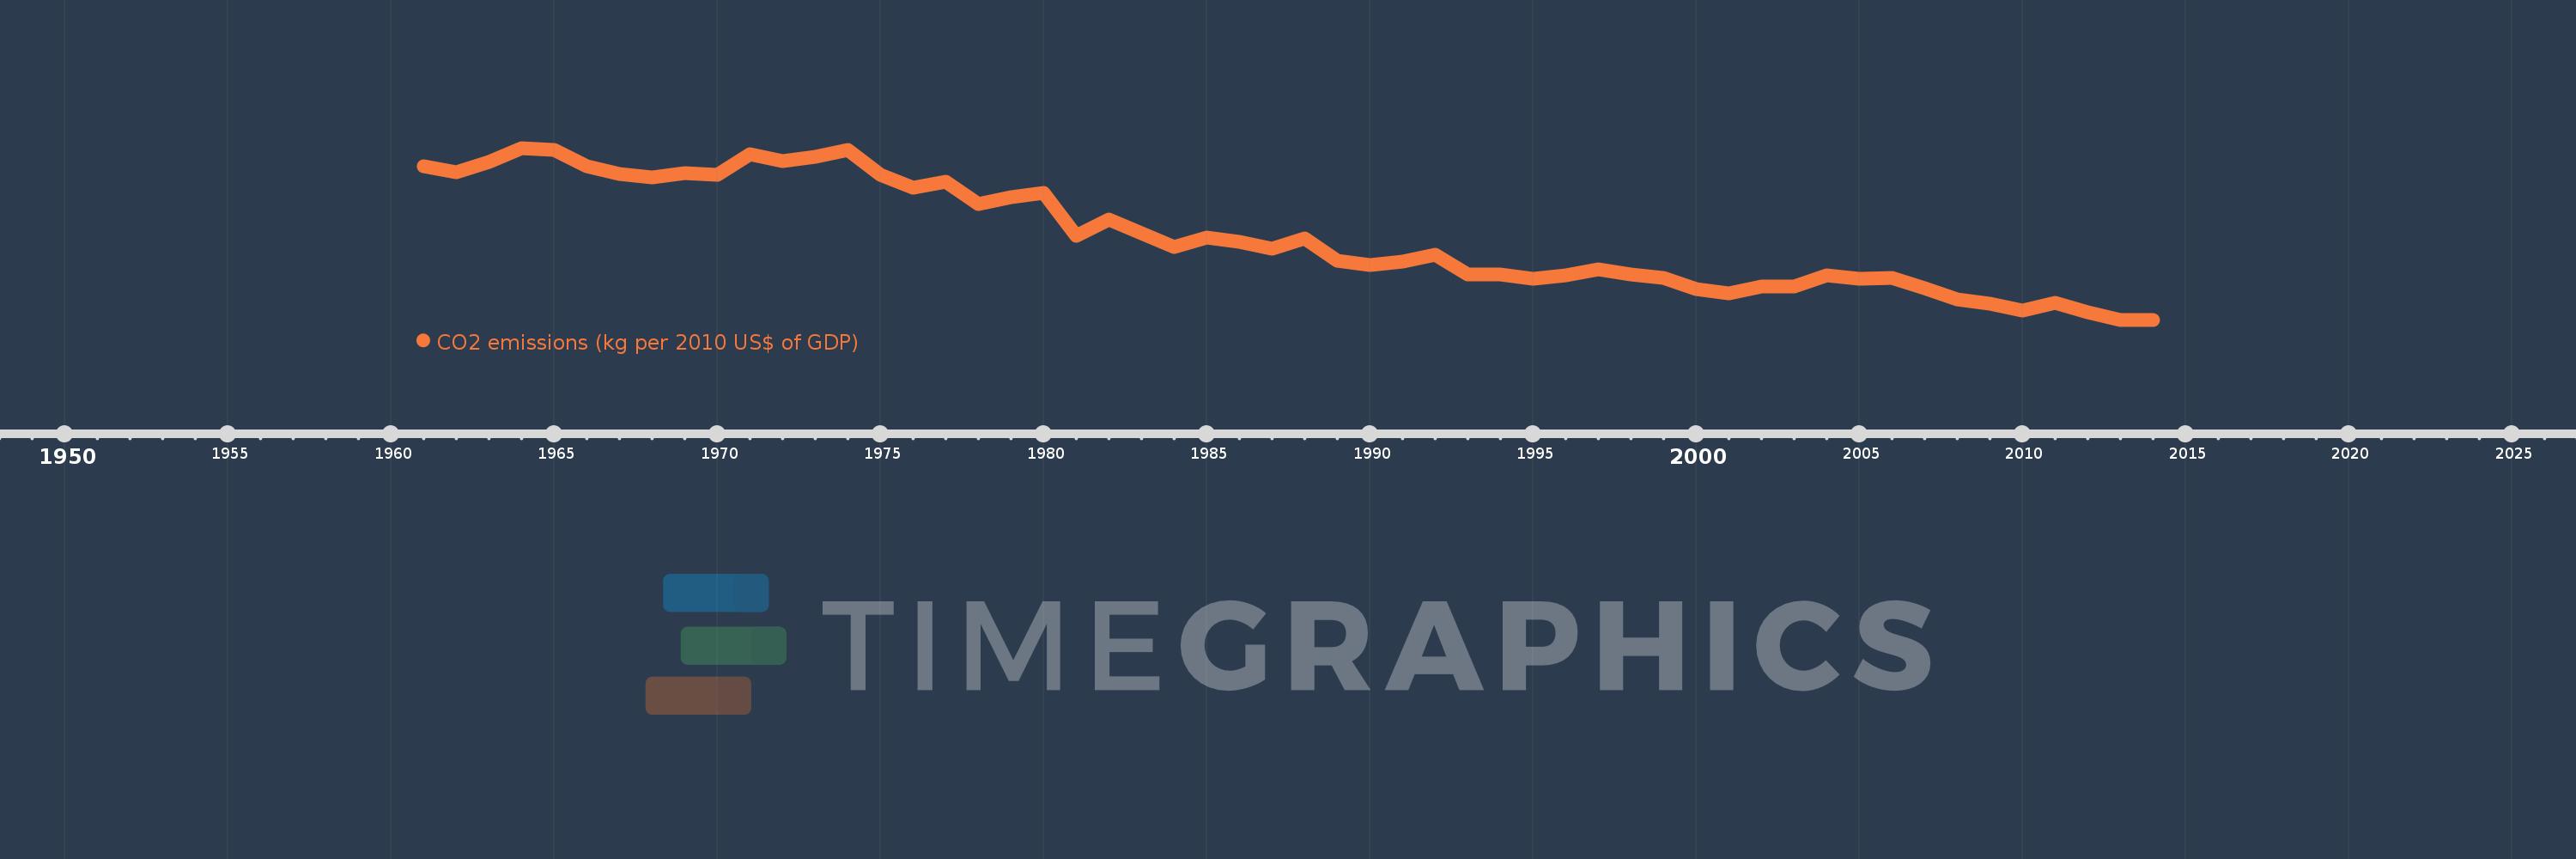
CO2 emissions (kg per 2010 US$ of GDP)
2014,2013,2012,2011,2010,2009,2008,2007,2006,2005,2004,2003,2002,2001,2000,1999,1998,1997,1996,1995,1994,1993,1992,1991,1990,1989,1988,1987,1986,1985,1984,1983,1982,1981,1980,1979,1978,1977,1976,1975,1974,1973,1972,1971,1970,1969,1968,1967,1966,1965,1964,1963,1962,1961
This statistics in other country:
AfghanistanAlbaniaAlgeriaAndorraAngolaAntigua and BarbudaArab WorldArgentinaArmeniaArubaAustraliaAustriaAzerbaijanBahamas, TheBahrainBangladeshBarbadosBelarusBelgiumBelizeBeninBermudaBhutanBoliviaBosnia and HerzegovinaBotswanaBrazilBrunei DarussalamBulgariaBurkina FasoBurundiCabo VerdeCambodiaCameroonCanadaCaribbean small statesCentral African RepublicCentral Europe and the BalticsChadChileChinaColombiaComorosCongo, Dem. Rep.Congo, Rep.Costa RicaCote d'IvoireCroatiaCubaCyprusCzech RepublicDenmarkDjiboutiDominicaDominican RepublicEarly-demographic dividendEast Asia & PacificEast Asia & Pacific (excluding high income)East Asia & Pacific (IDA & IBRD countries)EcuadorEgypt, Arab Rep.El SalvadorEquatorial GuineaEritreaEstoniaEthiopiaEuro areaEurope & Central AsiaEurope & Central Asia (excluding high income)Europe & Central Asia (IDA & IBRD countries)European UnionFaroe IslandsFijiFinlandFragile and conflict affected situationsFranceGabonGambia, TheGeorgiaGermanyGhanaGreeceGreenlandGrenadaGuatemalaGuineaGuinea-BissauGuyanaHaitiHeavily indebted poor countries (HIPC)High incomeHondurasHong Kong SAR, ChinaHungaryIBRD onlyIcelandIDA & IBRD totalIDA blendIDA onlyIDA totalIndiaIndonesiaIran, Islamic Rep.IraqIrelandIsraelItalyJamaicaJapanJordanKazakhstanKenyaKiribatiKorea, Rep.KuwaitKyrgyz RepublicLao PDRLate-demographic dividendLatin America & Caribbean Latin America & Caribbean (excluding high income)Latin America & the Caribbean (IDA & IBRD countries)LatviaLeast developed countries: UN classificationLebanonLesothoLiberiaLibyaLiechtensteinLithuaniaLow & middle incomeLow incomeLower middle incomeLuxembourgMacao SAR, ChinaMacedonia, FYRMadagascarMalawiMalaysiaMaldivesMaliMaltaMarshall IslandsMauritaniaMauritiusMexicoMicronesia, Fed. Sts.Middle East & North AfricaMiddle East & North Africa (excluding high income)Middle East & North Africa (IDA & IBRD countries)Middle incomeMoldovaMongoliaMontenegroMoroccoMozambiqueMyanmarNamibiaNauruNepalNetherlandsNew ZealandNicaraguaNigerNigeriaNorth AmericaNorwayOECD membersOmanOther small statesPacific island small statesPakistanPalauPanamaPapua New GuineaParaguayPeruPhilippinesPolandPortugalPost-demographic dividendPre-demographic dividendQatarRomaniaRussian FederationRwandaSamoaSao Tome and PrincipeSaudi ArabiaSenegalSerbiaSeychellesSierra LeoneSingaporeSlovak RepublicSloveniaSmall statesSolomon IslandsSouth AfricaSouth AsiaSouth Asia (IDA & IBRD)South SudanSpainSri LankaSt. Kitts and NevisSt. LuciaSt. Vincent and the GrenadinesSub-Saharan Africa Sub-Saharan Africa (excluding high income)Sub-Saharan Africa (IDA & IBRD countries)SudanSurinameSwazilandSwedenSwitzerlandTajikistanTanzaniaThailandTimor-LesteTogoTongaTrinidad and TobagoTunisiaTurkeyTurkmenistanUgandaUkraineUnited Arab EmiratesUnited KingdomUnited StatesUpper middle incomeUruguayUzbekistanVanuatuVenezuela, RBVietnamWest Bank and GazaWorldYemen, Rep.ZambiaZimbabwe Timeline:
This timeline shows a graph from 1961 to 2014 of Austria. No data until 1960. Number of actual observations by date: 54.
Source name:
World Development Indicators
Source organization:
Carbon Dioxide Information Analysis Center, Environmental Sciences Division, Oak Ridge National Laboratory, Tennessee, United States.
Categories, topics:
Climate Change, Environment
Last updated:
apr 23, 2017
Indicators value changes by year
At the date of observation
Value
Absolute change
Change from previous value
jan 1, 1961
0.334
+0.334
0.0%
jan 1, 1962
0.327
-0.007
-2.05%
jan 1, 1963
0.339
+0.012
3.66%
jan 1, 1964
0.355
+0.016
4.77%
jan 1, 1965
0.353
-0.003
-0.8%
jan 1, 1966
0.334
-0.018
-5.24%
jan 1, 1967
0.325
-0.009
-2.69%
jan 1, 1968
0.321
-0.004
-1.17%
jan 1, 1969
0.326
+0.005
1.43%
jan 1, 1970
0.324
-0.002
-0.7%
jan 1, 1971
0.348
+0.024
7.46%
jan 1, 1972
0.34
-0.007
-2.12%
jan 1, 1973
0.345
+0.005
1.44%
jan 1, 1974
0.353
+0.007
2.08%
jan 1, 1975
0.324
-0.029
-8.1%
jan 1, 1976
0.308
-0.016
-5.01%
jan 1, 1977
0.316
+0.008
2.69%
jan 1, 1978
0.289
-0.027
-8.41%
jan 1, 1979
0.297
+0.007
2.47%
jan 1, 1980
0.302
+0.005
1.7%
jan 1, 1981
0.252
-0.05
-16.53%
jan 1, 1982
0.271
+0.019
7.47%
jan 1, 1983
0.255
-0.016
-5.92%
jan 1, 1984
0.239
-0.016
-6.29%
jan 1, 1985
0.25
+0.012
4.88%
jan 1, 1986
0.245
-0.005
-2.17%
jan 1, 1987
0.237
-0.008
-3.36%
jan 1, 1988
0.249
+0.013
5.34%
jan 1, 1989
0.223
-0.026
-10.57%
jan 1, 1990
0.218
-0.005
-2.34%
jan 1, 1991
0.222
+0.005
2.15%
jan 1, 1992
0.23
+0.007
3.24%
jan 1, 1993
0.207
-0.023
-9.92%
jan 1, 1994
0.207
+0.001
0.25%
jan 1, 1995
0.202
-0.005
-2.43%
jan 1, 1996
0.206
+0.004
2.06%
jan 1, 1997
0.213
+0.007
3.2%
jan 1, 1998
0.207
-0.006
-2.96%
jan 1, 1999
0.203
-0.004
-1.89%
jan 1, 2000
0.19
-0.013
-6.18%
jan 1, 2001
0.185
-0.005
-2.85%
jan 1, 2002
0.193
+0.008
4.37%
jan 1, 2003
0.193
+0.0
0.14%
jan 1, 2004
0.206
+0.013
6.83%
jan 1, 2005
0.202
-0.005
-2.38%
jan 1, 2006
0.203
+0.001
0.62%
jan 1, 2007
0.191
-0.012
-5.92%
jan 1, 2008
0.178
-0.013
-6.76%
jan 1, 2009
0.173
-0.005
-2.61%
jan 1, 2010
0.165
-0.009
-4.97%
jan 1, 2011
0.174
+0.009
5.57%
jan 1, 2012
0.163
-0.011
-6.42%
jan 1, 2013
0.154
-0.009
-5.32%
jan 1, 2014
0.154
+0.0
0.13%
Ranking of countries by current statistics by years


Comments: