29
/
en
AIzaSyAYiBZKx7MnpbEhh9jyipgxe19OcubqV5w
April 1, 2024
207736
Netherlands
NLD
true
2
1
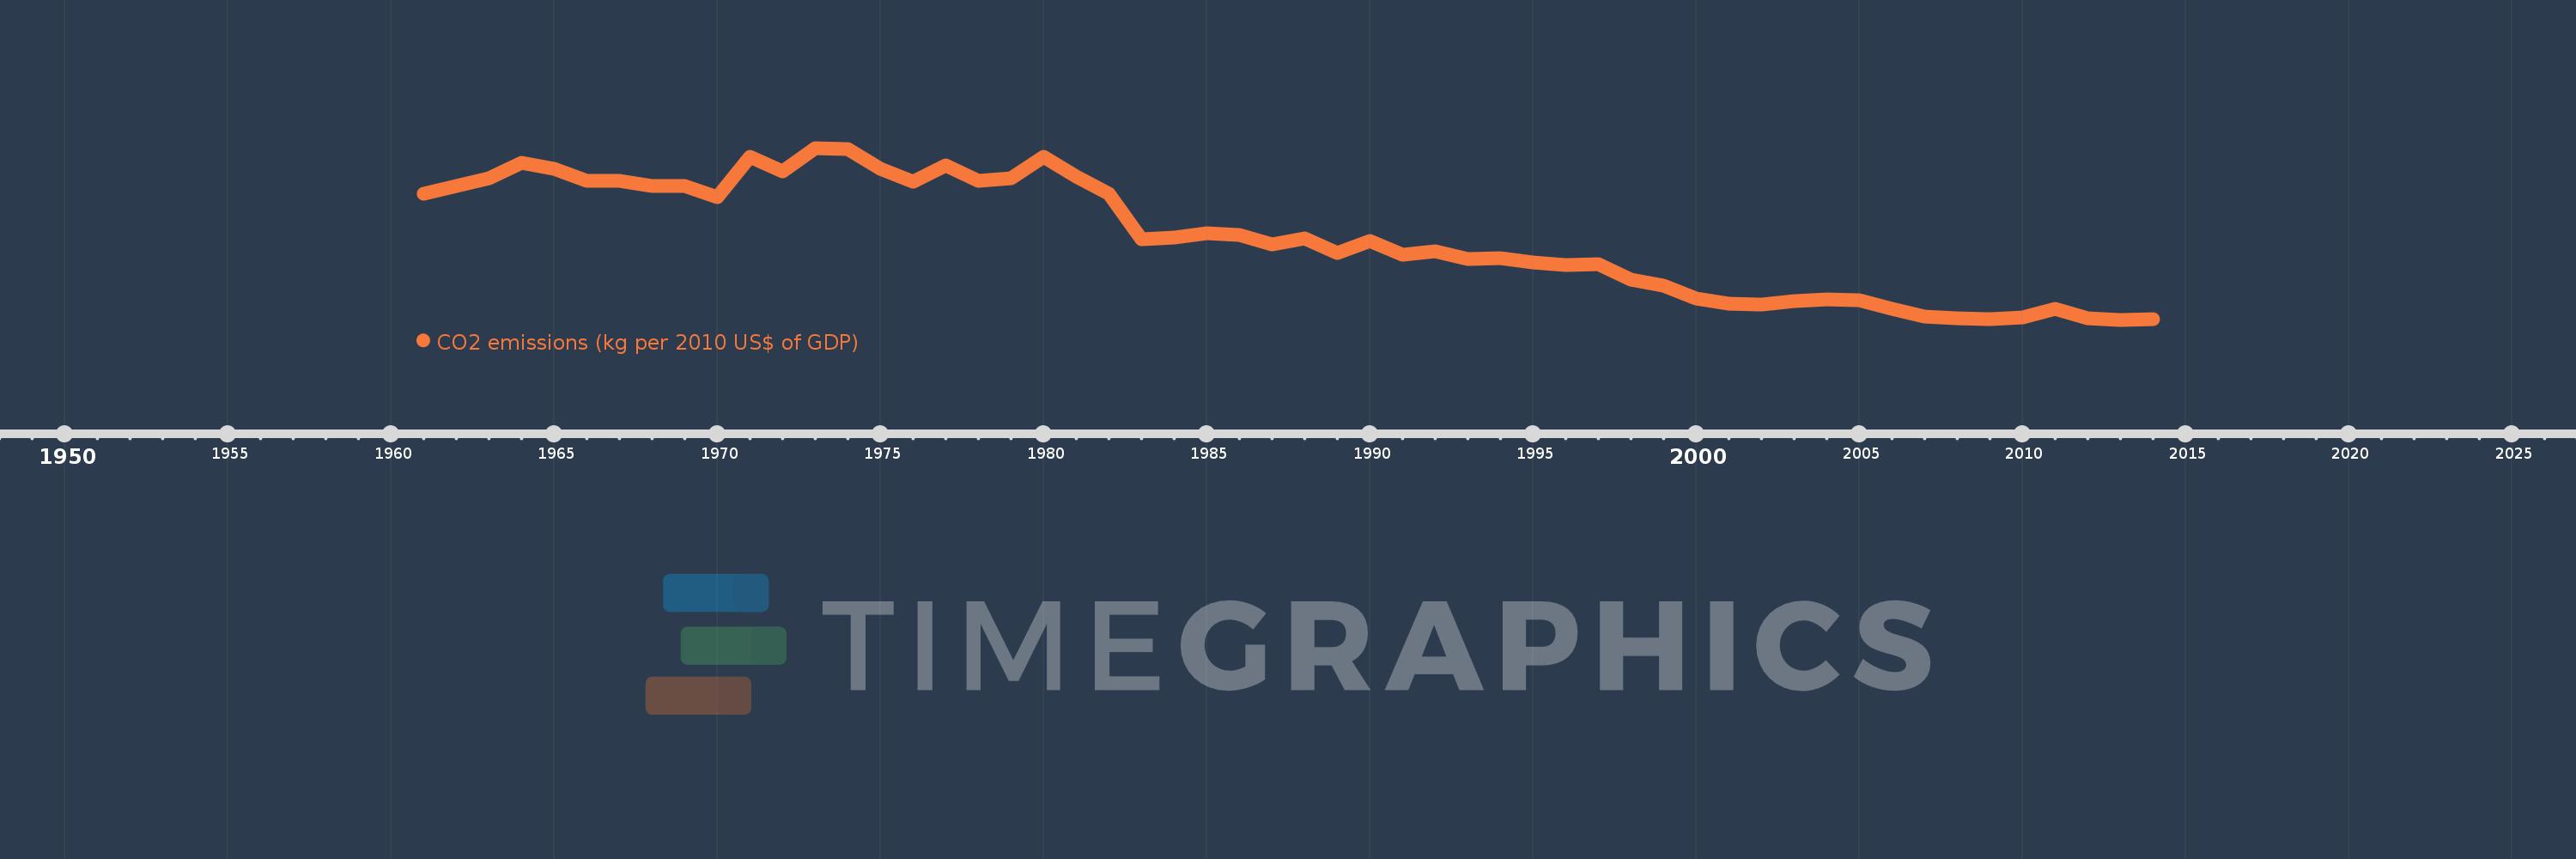
CO2 emissions (kg per 2010 US$ of GDP)
2014,2013,2012,2011,2010,2009,2008,2007,2006,2005,2004,2003,2002,2001,2000,1999,1998,1997,1996,1995,1994,1993,1992,1991,1990,1989,1988,1987,1986,1985,1984,1983,1982,1981,1980,1979,1978,1977,1976,1975,1974,1973,1972,1971,1970,1969,1968,1967,1966,1965,1964,1963,1962,1961
This statistics in other country:
AfghanistanAlbaniaAlgeriaAndorraAngolaAntigua and BarbudaArab WorldArgentinaArmeniaArubaAustraliaAustriaAzerbaijanBahamas, TheBahrainBangladeshBarbadosBelarusBelgiumBelizeBeninBermudaBhutanBoliviaBosnia and HerzegovinaBotswanaBrazilBrunei DarussalamBulgariaBurkina FasoBurundiCabo VerdeCambodiaCameroonCanadaCaribbean small statesCentral African RepublicCentral Europe and the BalticsChadChileChinaColombiaComorosCongo, Dem. Rep.Congo, Rep.Costa RicaCote d'IvoireCroatiaCubaCyprusCzech RepublicDenmarkDjiboutiDominicaDominican RepublicEarly-demographic dividendEast Asia & PacificEast Asia & Pacific (excluding high income)East Asia & Pacific (IDA & IBRD countries)EcuadorEgypt, Arab Rep.El SalvadorEquatorial GuineaEritreaEstoniaEthiopiaEuro areaEurope & Central AsiaEurope & Central Asia (excluding high income)Europe & Central Asia (IDA & IBRD countries)European UnionFaroe IslandsFijiFinlandFragile and conflict affected situationsFranceGabonGambia, TheGeorgiaGermanyGhanaGreeceGreenlandGrenadaGuatemalaGuineaGuinea-BissauGuyanaHaitiHeavily indebted poor countries (HIPC)High incomeHondurasHong Kong SAR, ChinaHungaryIBRD onlyIcelandIDA & IBRD totalIDA blendIDA onlyIDA totalIndiaIndonesiaIran, Islamic Rep.IraqIrelandIsraelItalyJamaicaJapanJordanKazakhstanKenyaKiribatiKorea, Rep.KuwaitKyrgyz RepublicLao PDRLate-demographic dividendLatin America & Caribbean Latin America & Caribbean (excluding high income)Latin America & the Caribbean (IDA & IBRD countries)LatviaLeast developed countries: UN classificationLebanonLesothoLiberiaLibyaLiechtensteinLithuaniaLow & middle incomeLow incomeLower middle incomeLuxembourgMacao SAR, ChinaMacedonia, FYRMadagascarMalawiMalaysiaMaldivesMaliMaltaMarshall IslandsMauritaniaMauritiusMexicoMicronesia, Fed. Sts.Middle East & North AfricaMiddle East & North Africa (excluding high income)Middle East & North Africa (IDA & IBRD countries)Middle incomeMoldovaMongoliaMontenegroMoroccoMozambiqueMyanmarNamibiaNauruNepalNetherlandsNew ZealandNicaraguaNigerNigeriaNorth AmericaNorwayOECD membersOmanOther small statesPacific island small statesPakistanPalauPanamaPapua New GuineaParaguayPeruPhilippinesPolandPortugalPost-demographic dividendPre-demographic dividendQatarRomaniaRussian FederationRwandaSamoaSao Tome and PrincipeSaudi ArabiaSenegalSerbiaSeychellesSierra LeoneSingaporeSlovak RepublicSloveniaSmall statesSolomon IslandsSouth AfricaSouth AsiaSouth Asia (IDA & IBRD)South SudanSpainSri LankaSt. Kitts and NevisSt. LuciaSt. Vincent and the GrenadinesSub-Saharan Africa Sub-Saharan Africa (excluding high income)Sub-Saharan Africa (IDA & IBRD countries)SudanSurinameSwazilandSwedenSwitzerlandTajikistanTanzaniaThailandTimor-LesteTogoTongaTrinidad and TobagoTunisiaTurkeyTurkmenistanUgandaUkraineUnited Arab EmiratesUnited KingdomUnited StatesUpper middle incomeUruguayUzbekistanVanuatuVenezuela, RBVietnamWest Bank and GazaWorldYemen, Rep.ZambiaZimbabwe Timeline:
This timeline shows a graph from 1961 to 2014 of Netherlands. No data until 1960. Number of actual observations by date: 54.
Source name:
World Development Indicators
Source organization:
Carbon Dioxide Information Analysis Center, Environmental Sciences Division, Oak Ridge National Laboratory, Tennessee, United States.
Categories, topics:
Climate Change, Environment
Last updated:
apr 23, 2017
Indicators value changes by year
At the date of observation
Value
Absolute change
Change from previous value
jan 1, 1961
0.391
+0.391
0.0%
jan 1, 1962
0.403
+0.011
2.94%
jan 1, 1963
0.414
+0.011
2.81%
jan 1, 1964
0.437
+0.023
5.61%
jan 1, 1965
0.429
-0.008
-1.93%
jan 1, 1966
0.41
-0.019
-4.51%
jan 1, 1967
0.411
+0.002
0.39%
jan 1, 1968
0.402
-0.009
-2.15%
jan 1, 1969
0.402
0.0
-0.07%
jan 1, 1970
0.386
-0.016
-4.09%
jan 1, 1971
0.447
+0.061
15.85%
jan 1, 1972
0.425
-0.022
-4.85%
jan 1, 1973
0.46
+0.035
8.19%
jan 1, 1974
0.458
-0.002
-0.44%
jan 1, 1975
0.429
-0.029
-6.36%
jan 1, 1976
0.409
-0.02
-4.63%
jan 1, 1977
0.434
+0.025
6.16%
jan 1, 1978
0.41
-0.024
-5.57%
jan 1, 1979
0.414
+0.004
1.09%
jan 1, 1980
0.447
+0.033
7.95%
jan 1, 1981
0.417
-0.03
-6.74%
jan 1, 1982
0.391
-0.026
-6.34%
jan 1, 1983
0.322
-0.069
-17.55%
jan 1, 1984
0.325
+0.003
0.84%
jan 1, 1985
0.331
+0.006
1.8%
jan 1, 1986
0.329
-0.002
-0.57%
jan 1, 1987
0.314
-0.015
-4.59%
jan 1, 1988
0.324
+0.01
3.16%
jan 1, 1989
0.301
-0.022
-6.91%
jan 1, 1990
0.32
+0.019
6.32%
jan 1, 1991
0.299
-0.022
-6.78%
jan 1, 1992
0.304
+0.005
1.78%
jan 1, 1993
0.293
-0.01
-3.42%
jan 1, 1994
0.294
+0.001
0.33%
jan 1, 1995
0.287
-0.008
-2.58%
jan 1, 1996
0.283
-0.004
-1.27%
jan 1, 1997
0.285
+0.001
0.48%
jan 1, 1998
0.261
-0.023
-8.11%
jan 1, 1999
0.252
-0.01
-3.78%
jan 1, 2000
0.233
-0.019
-7.58%
jan 1, 2001
0.225
-0.007
-3.22%
jan 1, 2002
0.224
-0.001
-0.48%
jan 1, 2003
0.229
+0.005
2.25%
jan 1, 2004
0.232
+0.003
1.33%
jan 1, 2005
0.23
-0.002
-0.93%
jan 1, 2006
0.217
-0.013
-5.68%
jan 1, 2007
0.206
-0.011
-5.18%
jan 1, 2008
0.203
-0.002
-1.04%
jan 1, 2009
0.202
-0.001
-0.6%
jan 1, 2010
0.205
+0.003
1.41%
jan 1, 2011
0.217
+0.012
5.88%
jan 1, 2012
0.203
-0.014
-6.64%
jan 1, 2013
0.201
-0.001
-0.7%
jan 1, 2014
0.202
+0.001
0.54%
Ranking of countries by current statistics by years


Comments: