29
/
en
AIzaSyAYiBZKx7MnpbEhh9jyipgxe19OcubqV5w
April 1, 2024
57914
South Asia (IDA & IBRD)
TSA
false
2
1
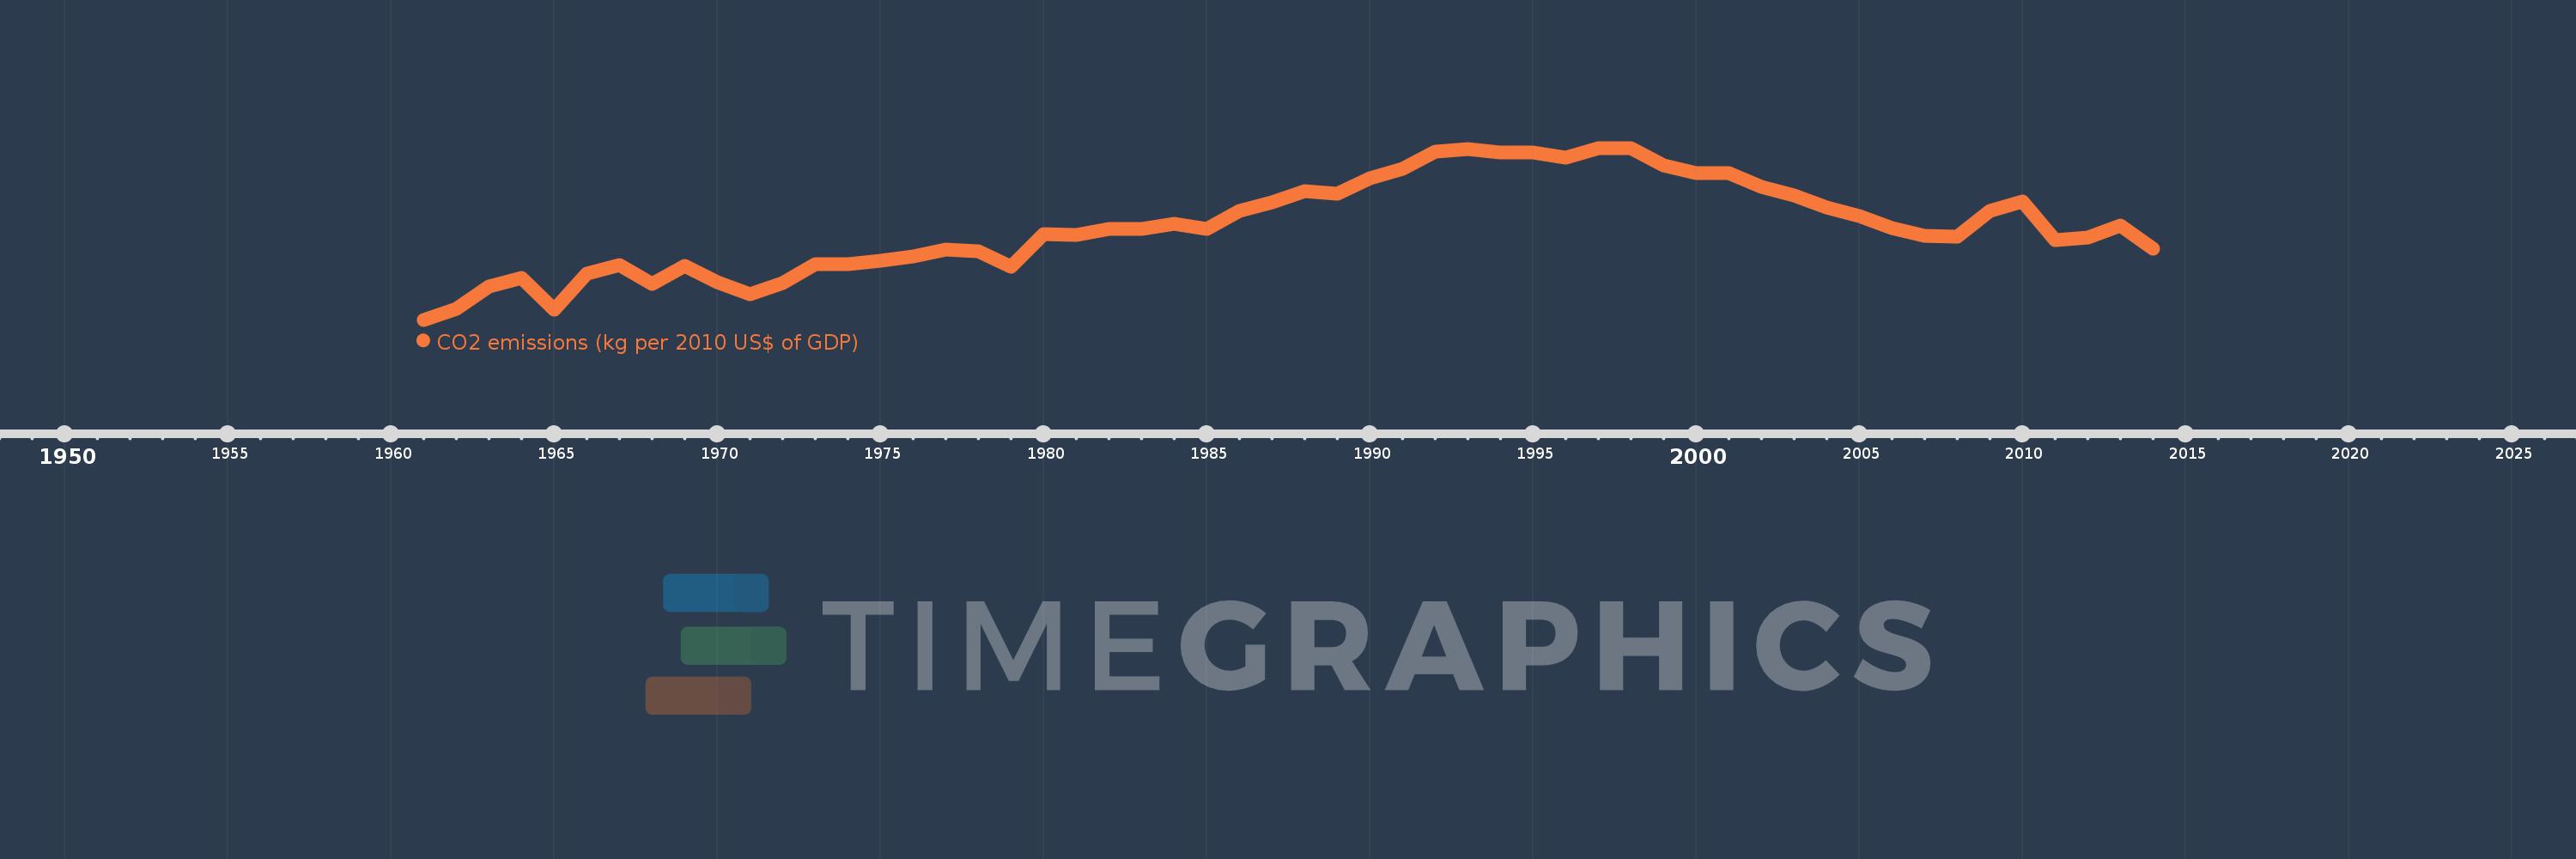
CO2 emissions (kg per 2010 US$ of GDP)
2014,2013,2012,2011,2010,2009,2008,2007,2006,2005,2004,2003,2002,2001,2000,1999,1998,1997,1996,1995,1994,1993,1992,1991,1990,1989,1988,1987,1986,1985,1984,1983,1982,1981,1980,1979,1978,1977,1976,1975,1974,1973,1972,1971,1970,1969,1968,1967,1966,1965,1964,1963,1962,1961
This statistics in other country:
AfghanistanAlbaniaAlgeriaAndorraAngolaAntigua and BarbudaArab WorldArgentinaArmeniaArubaAustraliaAustriaAzerbaijanBahamas, TheBahrainBangladeshBarbadosBelarusBelgiumBelizeBeninBermudaBhutanBoliviaBosnia and HerzegovinaBotswanaBrazilBrunei DarussalamBulgariaBurkina FasoBurundiCabo VerdeCambodiaCameroonCanadaCaribbean small statesCentral African RepublicCentral Europe and the BalticsChadChileChinaColombiaComorosCongo, Dem. Rep.Congo, Rep.Costa RicaCote d'IvoireCroatiaCubaCyprusCzech RepublicDenmarkDjiboutiDominicaDominican RepublicEarly-demographic dividendEast Asia & PacificEast Asia & Pacific (excluding high income)East Asia & Pacific (IDA & IBRD countries)EcuadorEgypt, Arab Rep.El SalvadorEquatorial GuineaEritreaEstoniaEthiopiaEuro areaEurope & Central AsiaEurope & Central Asia (excluding high income)Europe & Central Asia (IDA & IBRD countries)European UnionFaroe IslandsFijiFinlandFragile and conflict affected situationsFranceGabonGambia, TheGeorgiaGermanyGhanaGreeceGreenlandGrenadaGuatemalaGuineaGuinea-BissauGuyanaHaitiHeavily indebted poor countries (HIPC)High incomeHondurasHong Kong SAR, ChinaHungaryIBRD onlyIcelandIDA & IBRD totalIDA blendIDA onlyIDA totalIndiaIndonesiaIran, Islamic Rep.IraqIrelandIsraelItalyJamaicaJapanJordanKazakhstanKenyaKiribatiKorea, Rep.KuwaitKyrgyz RepublicLao PDRLate-demographic dividendLatin America & Caribbean Latin America & Caribbean (excluding high income)Latin America & the Caribbean (IDA & IBRD countries)LatviaLeast developed countries: UN classificationLebanonLesothoLiberiaLibyaLiechtensteinLithuaniaLow & middle incomeLow incomeLower middle incomeLuxembourgMacao SAR, ChinaMacedonia, FYRMadagascarMalawiMalaysiaMaldivesMaliMaltaMarshall IslandsMauritaniaMauritiusMexicoMicronesia, Fed. Sts.Middle East & North AfricaMiddle East & North Africa (excluding high income)Middle East & North Africa (IDA & IBRD countries)Middle incomeMoldovaMongoliaMontenegroMoroccoMozambiqueMyanmarNamibiaNauruNepalNetherlandsNew ZealandNicaraguaNigerNigeriaNorth AmericaNorwayOECD membersOmanOther small statesPacific island small statesPakistanPalauPanamaPapua New GuineaParaguayPeruPhilippinesPolandPortugalPost-demographic dividendPre-demographic dividendQatarRomaniaRussian FederationRwandaSamoaSao Tome and PrincipeSaudi ArabiaSenegalSerbiaSeychellesSierra LeoneSingaporeSlovak RepublicSloveniaSmall statesSolomon IslandsSouth AfricaSouth AsiaSouth Asia (IDA & IBRD)South SudanSpainSri LankaSt. Kitts and NevisSt. LuciaSt. Vincent and the GrenadinesSub-Saharan Africa Sub-Saharan Africa (excluding high income)Sub-Saharan Africa (IDA & IBRD countries)SudanSurinameSwazilandSwedenSwitzerlandTajikistanTanzaniaThailandTimor-LesteTogoTongaTrinidad and TobagoTunisiaTurkeyTurkmenistanUgandaUkraineUnited Arab EmiratesUnited KingdomUnited StatesUpper middle incomeUruguayUzbekistanVanuatuVenezuela, RBVietnamWest Bank and GazaWorldYemen, Rep.ZambiaZimbabwe Timeline:
This timeline shows a graph from 1961 to 2014 of South Asia (IDA & IBRD). No data until 1960. Number of actual observations by date: 54.
Source name:
World Development Indicators
Source organization:
Carbon Dioxide Information Analysis Center, Environmental Sciences Division, Oak Ridge National Laboratory, Tennessee, United States.
Categories, topics:
Climate Change, Environment
Last updated:
apr 23, 2017
Indicators value changes by year
At the date of observation
Value
Absolute change
Change from previous value
jan 1, 1961
0.776
+0.776
0.0%
jan 1, 1962
0.802
+0.026
3.37%
jan 1, 1963
0.855
+0.053
6.56%
jan 1, 1964
0.876
+0.021
2.5%
jan 1, 1965
0.8
-0.076
-8.73%
jan 1, 1966
0.886
+0.086
10.81%
jan 1, 1967
0.906
+0.02
2.26%
jan 1, 1968
0.862
-0.045
-4.94%
jan 1, 1969
0.903
+0.041
4.76%
jan 1, 1970
0.866
-0.036
-4.02%
jan 1, 1971
0.836
-0.03
-3.44%
jan 1, 1972
0.864
+0.028
3.31%
jan 1, 1973
0.908
+0.044
5.04%
jan 1, 1974
0.907
-0.001
-0.08%
jan 1, 1975
0.917
+0.01
1.11%
jan 1, 1976
0.927
+0.01
1.12%
jan 1, 1977
0.942
+0.015
1.6%
jan 1, 1978
0.938
-0.004
-0.45%
jan 1, 1979
0.902
-0.036
-3.81%
jan 1, 1980
0.98
+0.078
8.62%
jan 1, 1981
0.977
-0.002
-0.25%
jan 1, 1982
0.991
+0.014
1.41%
jan 1, 1983
0.992
+0.001
0.11%
jan 1, 1984
1.004
+0.012
1.22%
jan 1, 1985
0.992
-0.013
-1.25%
jan 1, 1986
1.035
+0.043
4.36%
jan 1, 1987
1.055
+0.02
1.96%
jan 1, 1988
1.082
+0.027
2.55%
jan 1, 1989
1.076
-0.006
-0.54%
jan 1, 1990
1.111
+0.035
3.24%
jan 1, 1991
1.134
+0.022
2.01%
jan 1, 1992
1.175
+0.041
3.6%
jan 1, 1993
1.182
+0.007
0.6%
jan 1, 1994
1.173
-0.008
-0.69%
jan 1, 1995
1.173
0.0
0.0%
jan 1, 1996
1.161
-0.012
-1.06%
jan 1, 1997
1.184
+0.023
2.01%
jan 1, 1998
1.183
-0.001
-0.08%
jan 1, 1999
1.142
-0.041
-3.49%
jan 1, 2000
1.124
-0.018
-1.56%
jan 1, 2001
1.124
0.0
0.0%
jan 1, 2002
1.092
-0.032
-2.84%
jan 1, 2003
1.071
-0.021
-1.93%
jan 1, 2004
1.042
-0.029
-2.74%
jan 1, 2005
1.023
-0.019
-1.85%
jan 1, 2006
0.993
-0.03
-2.89%
jan 1, 2007
0.975
-0.018
-1.84%
jan 1, 2008
0.973
-0.002
-0.2%
jan 1, 2009
1.034
+0.061
6.23%
jan 1, 2010
1.056
+0.022
2.16%
jan 1, 2011
0.965
-0.091
-8.64%
jan 1, 2012
0.971
+0.006
0.62%
jan 1, 2013
1.0
+0.029
3.03%
jan 1, 2014
0.945
-0.055
-5.51%
Ranking of countries by current statistics by years


Comments: