29
/
en
AIzaSyAYiBZKx7MnpbEhh9jyipgxe19OcubqV5w
April 1, 2024
219377
Papua New Guinea
PNG
true
2
1
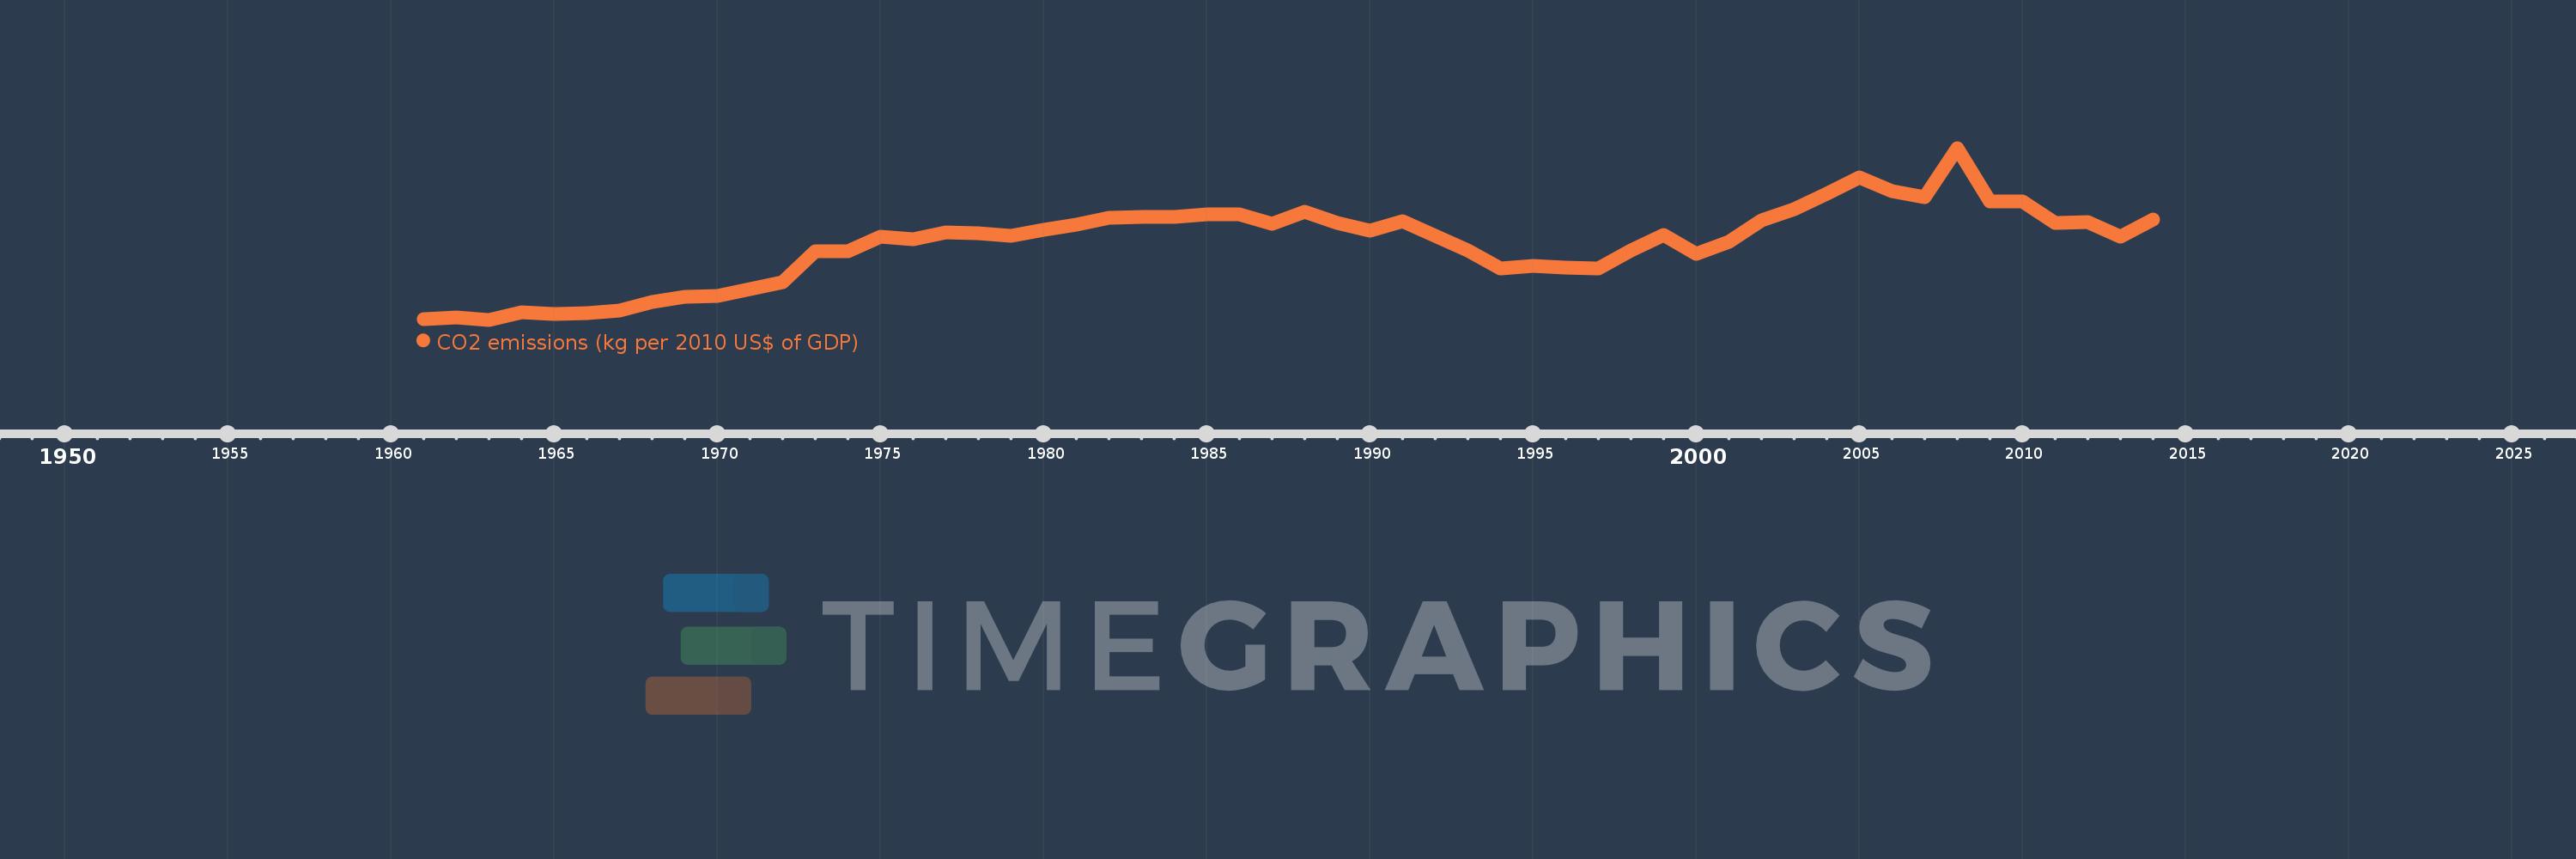
CO2 emissions (kg per 2010 US$ of GDP)
2014,2013,2012,2011,2010,2009,2008,2007,2006,2005,2004,2003,2002,2001,2000,1999,1998,1997,1996,1995,1994,1993,1992,1991,1990,1989,1988,1987,1986,1985,1984,1983,1982,1981,1980,1979,1978,1977,1976,1975,1974,1973,1972,1971,1970,1969,1968,1967,1966,1965,1964,1963,1962,1961
This statistics in other country:
AfghanistanAlbaniaAlgeriaAndorraAngolaAntigua and BarbudaArab WorldArgentinaArmeniaArubaAustraliaAustriaAzerbaijanBahamas, TheBahrainBangladeshBarbadosBelarusBelgiumBelizeBeninBermudaBhutanBoliviaBosnia and HerzegovinaBotswanaBrazilBrunei DarussalamBulgariaBurkina FasoBurundiCabo VerdeCambodiaCameroonCanadaCaribbean small statesCentral African RepublicCentral Europe and the BalticsChadChileChinaColombiaComorosCongo, Dem. Rep.Congo, Rep.Costa RicaCote d'IvoireCroatiaCubaCyprusCzech RepublicDenmarkDjiboutiDominicaDominican RepublicEarly-demographic dividendEast Asia & PacificEast Asia & Pacific (excluding high income)East Asia & Pacific (IDA & IBRD countries)EcuadorEgypt, Arab Rep.El SalvadorEquatorial GuineaEritreaEstoniaEthiopiaEuro areaEurope & Central AsiaEurope & Central Asia (excluding high income)Europe & Central Asia (IDA & IBRD countries)European UnionFaroe IslandsFijiFinlandFragile and conflict affected situationsFranceGabonGambia, TheGeorgiaGermanyGhanaGreeceGreenlandGrenadaGuatemalaGuineaGuinea-BissauGuyanaHaitiHeavily indebted poor countries (HIPC)High incomeHondurasHong Kong SAR, ChinaHungaryIBRD onlyIcelandIDA & IBRD totalIDA blendIDA onlyIDA totalIndiaIndonesiaIran, Islamic Rep.IraqIrelandIsraelItalyJamaicaJapanJordanKazakhstanKenyaKiribatiKorea, Rep.KuwaitKyrgyz RepublicLao PDRLate-demographic dividendLatin America & Caribbean Latin America & Caribbean (excluding high income)Latin America & the Caribbean (IDA & IBRD countries)LatviaLeast developed countries: UN classificationLebanonLesothoLiberiaLibyaLiechtensteinLithuaniaLow & middle incomeLow incomeLower middle incomeLuxembourgMacao SAR, ChinaMacedonia, FYRMadagascarMalawiMalaysiaMaldivesMaliMaltaMarshall IslandsMauritaniaMauritiusMexicoMicronesia, Fed. Sts.Middle East & North AfricaMiddle East & North Africa (excluding high income)Middle East & North Africa (IDA & IBRD countries)Middle incomeMoldovaMongoliaMontenegroMoroccoMozambiqueMyanmarNamibiaNauruNepalNetherlandsNew ZealandNicaraguaNigerNigeriaNorth AmericaNorwayOECD membersOmanOther small statesPacific island small statesPakistanPalauPanamaPapua New GuineaParaguayPeruPhilippinesPolandPortugalPost-demographic dividendPre-demographic dividendQatarRomaniaRussian FederationRwandaSamoaSao Tome and PrincipeSaudi ArabiaSenegalSerbiaSeychellesSierra LeoneSingaporeSlovak RepublicSloveniaSmall statesSolomon IslandsSouth AfricaSouth AsiaSouth Asia (IDA & IBRD)South SudanSpainSri LankaSt. Kitts and NevisSt. LuciaSt. Vincent and the GrenadinesSub-Saharan Africa Sub-Saharan Africa (excluding high income)Sub-Saharan Africa (IDA & IBRD countries)SudanSurinameSwazilandSwedenSwitzerlandTajikistanTanzaniaThailandTimor-LesteTogoTongaTrinidad and TobagoTunisiaTurkeyTurkmenistanUgandaUkraineUnited Arab EmiratesUnited KingdomUnited StatesUpper middle incomeUruguayUzbekistanVanuatuVenezuela, RBVietnamWest Bank and GazaWorldYemen, Rep.ZambiaZimbabwe Timeline:
This timeline shows a graph from 1961 to 2014 of Papua New Guinea. No data until 1960. Number of actual observations by date: 54.
Source name:
World Development Indicators
Source organization:
Carbon Dioxide Information Analysis Center, Environmental Sciences Division, Oak Ridge National Laboratory, Tennessee, United States.
Categories, topics:
Climate Change, Environment
Last updated:
apr 23, 2017
Indicators value changes by year
At the date of observation
Value
Absolute change
Change from previous value
jan 1, 1961
0.116
+0.116
0.0%
jan 1, 1962
0.122
+0.007
5.71%
jan 1, 1963
0.113
-0.009
-7.7%
jan 1, 1964
0.141
+0.028
24.56%
jan 1, 1965
0.135
-0.006
-3.95%
jan 1, 1966
0.139
+0.004
3.11%
jan 1, 1967
0.147
+0.008
5.89%
jan 1, 1968
0.181
+0.034
22.95%
jan 1, 1969
0.2
+0.019
10.32%
jan 1, 1970
0.205
+0.005
2.47%
jan 1, 1971
0.23
+0.025
12.18%
jan 1, 1972
0.257
+0.028
12.0%
jan 1, 1973
0.375
+0.117
45.56%
jan 1, 1974
0.373
-0.002
-0.43%
jan 1, 1975
0.429
+0.056
14.98%
jan 1, 1976
0.418
-0.011
-2.61%
jan 1, 1977
0.444
+0.026
6.23%
jan 1, 1978
0.442
-0.002
-0.37%
jan 1, 1979
0.432
-0.01
-2.32%
jan 1, 1980
0.455
+0.023
5.29%
jan 1, 1981
0.474
+0.019
4.24%
jan 1, 1982
0.502
+0.028
5.9%
jan 1, 1983
0.504
+0.002
0.4%
jan 1, 1984
0.504
0.0
-0.02%
jan 1, 1985
0.515
+0.011
2.19%
jan 1, 1986
0.515
0.0
-0.06%
jan 1, 1987
0.477
-0.037
-7.28%
jan 1, 1988
0.525
+0.048
10.09%
jan 1, 1989
0.481
-0.044
-8.47%
jan 1, 1990
0.451
-0.03
-6.17%
jan 1, 1991
0.489
+0.038
8.49%
jan 1, 1992
0.431
-0.059
-12.0%
jan 1, 1993
0.376
-0.054
-12.63%
jan 1, 1994
0.309
-0.067
-17.82%
jan 1, 1995
0.319
+0.01
3.24%
jan 1, 1996
0.312
-0.007
-2.31%
jan 1, 1997
0.308
-0.004
-1.4%
jan 1, 1998
0.377
+0.069
22.54%
jan 1, 1999
0.435
+0.058
15.45%
jan 1, 2000
0.365
-0.07
-16.15%
jan 1, 2001
0.408
+0.043
11.78%
jan 1, 2002
0.491
+0.084
20.5%
jan 1, 2003
0.535
+0.044
8.86%
jan 1, 2004
0.592
+0.057
10.75%
jan 1, 2005
0.656
+0.064
10.74%
jan 1, 2006
0.603
-0.053
-8.12%
jan 1, 2007
0.579
-0.024
-3.96%
jan 1, 2008
0.767
+0.189
32.56%
jan 1, 2009
0.564
-0.203
-26.49%
jan 1, 2010
0.564
+0.0
0.05%
jan 1, 2011
0.48
-0.084
-14.95%
jan 1, 2012
0.486
+0.006
1.3%
jan 1, 2013
0.428
-0.058
-11.89%
jan 1, 2014
0.495
+0.067
15.55%
Ranking of countries by current statistics by years


Comments: