29
/
en
AIzaSyAYiBZKx7MnpbEhh9jyipgxe19OcubqV5w
April 1, 2024
89563
Botswana
BWA
true
2
1
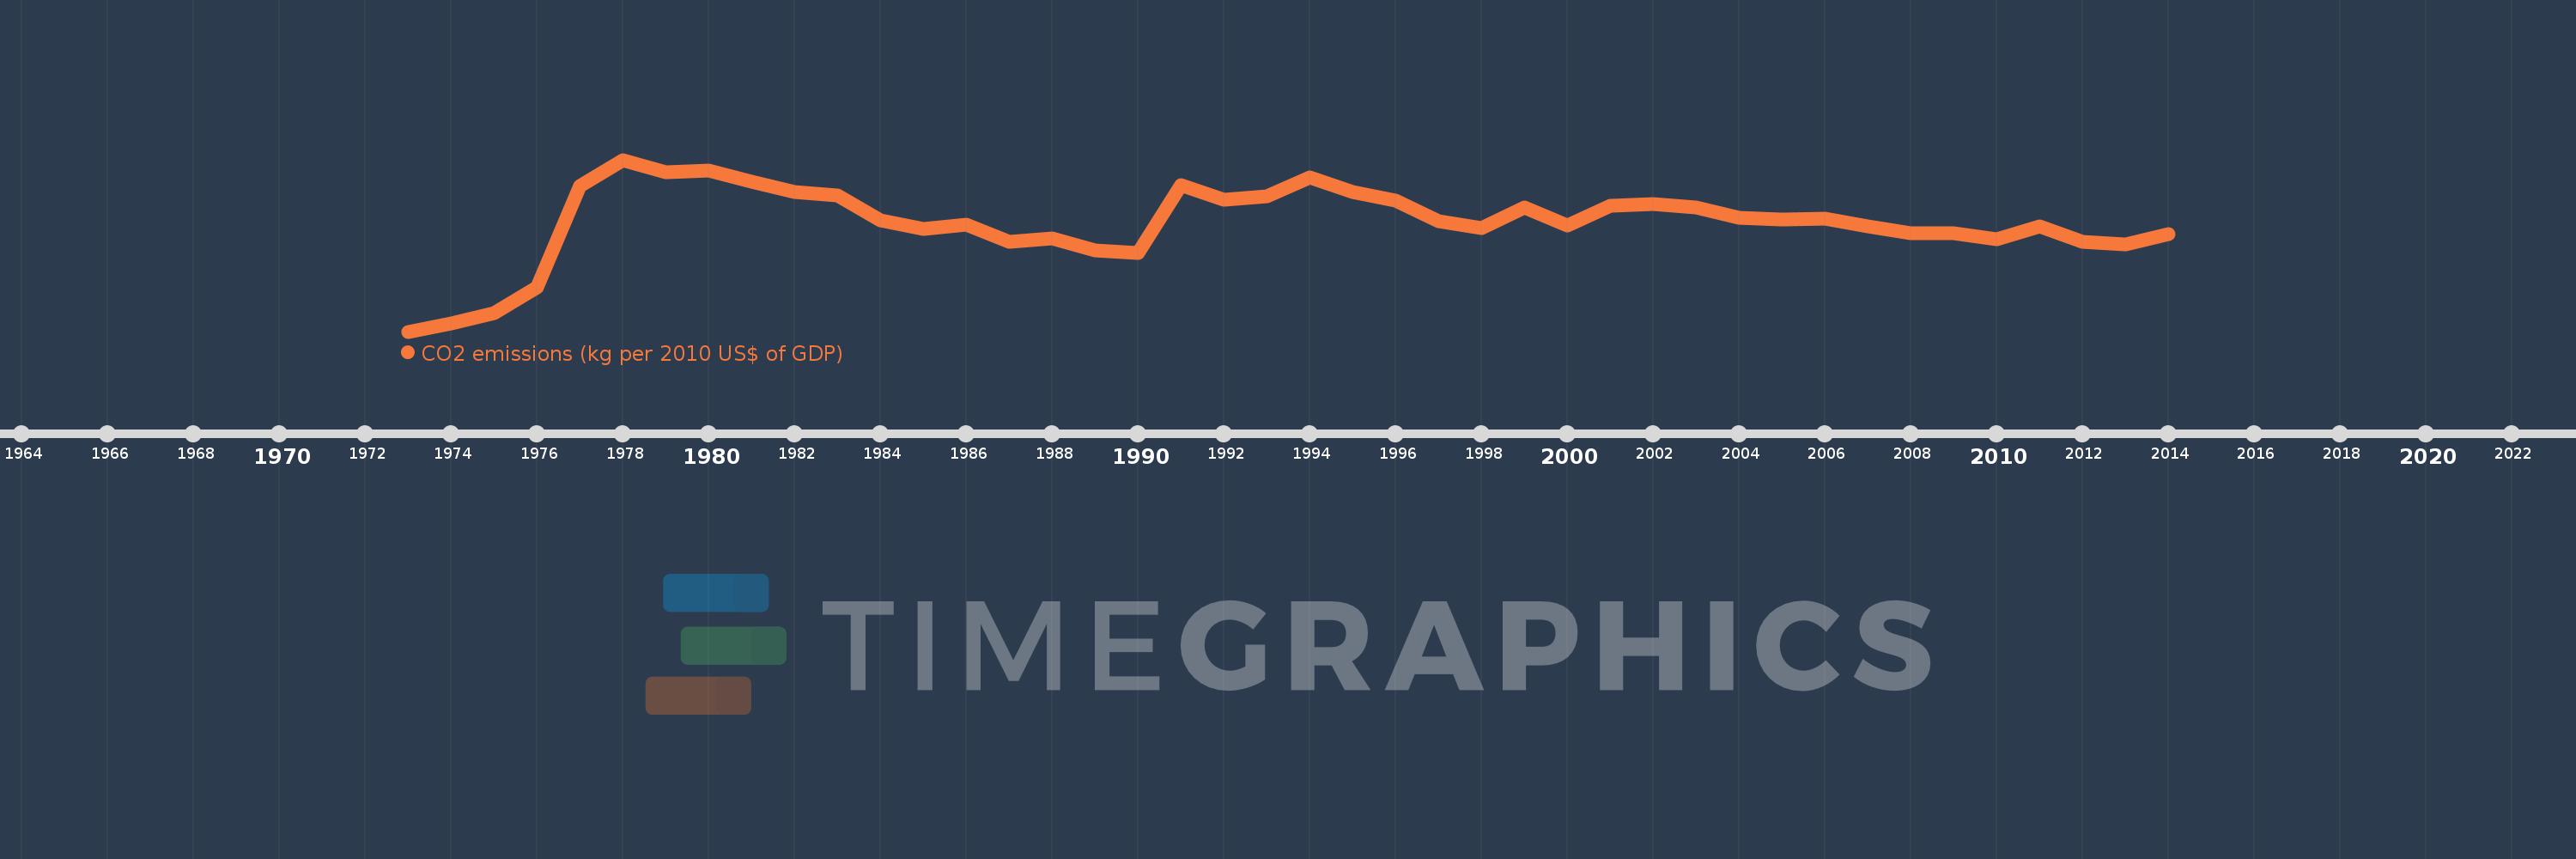
CO2 emissions (kg per 2010 US$ of GDP)
2014,2013,2012,2011,2010,2009,2008,2007,2006,2005,2004,2003,2002,2001,2000,1999,1998,1997,1996,1995,1994,1993,1992,1991,1990,1989,1988,1987,1986,1985,1984,1983,1982,1981,1980,1979,1978,1977,1976,1975,1974,1973
This statistics in other country:
AfghanistanAlbaniaAlgeriaAndorraAngolaAntigua and BarbudaArab WorldArgentinaArmeniaArubaAustraliaAustriaAzerbaijanBahamas, TheBahrainBangladeshBarbadosBelarusBelgiumBelizeBeninBermudaBhutanBoliviaBosnia and HerzegovinaBotswanaBrazilBrunei DarussalamBulgariaBurkina FasoBurundiCabo VerdeCambodiaCameroonCanadaCaribbean small statesCentral African RepublicCentral Europe and the BalticsChadChileChinaColombiaComorosCongo, Dem. Rep.Congo, Rep.Costa RicaCote d'IvoireCroatiaCubaCyprusCzech RepublicDenmarkDjiboutiDominicaDominican RepublicEarly-demographic dividendEast Asia & PacificEast Asia & Pacific (excluding high income)East Asia & Pacific (IDA & IBRD countries)EcuadorEgypt, Arab Rep.El SalvadorEquatorial GuineaEritreaEstoniaEthiopiaEuro areaEurope & Central AsiaEurope & Central Asia (excluding high income)Europe & Central Asia (IDA & IBRD countries)European UnionFaroe IslandsFijiFinlandFragile and conflict affected situationsFranceGabonGambia, TheGeorgiaGermanyGhanaGreeceGreenlandGrenadaGuatemalaGuineaGuinea-BissauGuyanaHaitiHeavily indebted poor countries (HIPC)High incomeHondurasHong Kong SAR, ChinaHungaryIBRD onlyIcelandIDA & IBRD totalIDA blendIDA onlyIDA totalIndiaIndonesiaIran, Islamic Rep.IraqIrelandIsraelItalyJamaicaJapanJordanKazakhstanKenyaKiribatiKorea, Rep.KuwaitKyrgyz RepublicLao PDRLate-demographic dividendLatin America & Caribbean Latin America & Caribbean (excluding high income)Latin America & the Caribbean (IDA & IBRD countries)LatviaLeast developed countries: UN classificationLebanonLesothoLiberiaLibyaLiechtensteinLithuaniaLow & middle incomeLow incomeLower middle incomeLuxembourgMacao SAR, ChinaMacedonia, FYRMadagascarMalawiMalaysiaMaldivesMaliMaltaMarshall IslandsMauritaniaMauritiusMexicoMicronesia, Fed. Sts.Middle East & North AfricaMiddle East & North Africa (excluding high income)Middle East & North Africa (IDA & IBRD countries)Middle incomeMoldovaMongoliaMontenegroMoroccoMozambiqueMyanmarNamibiaNauruNepalNetherlandsNew ZealandNicaraguaNigerNigeriaNorth AmericaNorwayOECD membersOmanOther small statesPacific island small statesPakistanPalauPanamaPapua New GuineaParaguayPeruPhilippinesPolandPortugalPost-demographic dividendPre-demographic dividendQatarRomaniaRussian FederationRwandaSamoaSao Tome and PrincipeSaudi ArabiaSenegalSerbiaSeychellesSierra LeoneSingaporeSlovak RepublicSloveniaSmall statesSolomon IslandsSouth AfricaSouth AsiaSouth Asia (IDA & IBRD)South SudanSpainSri LankaSt. Kitts and NevisSt. LuciaSt. Vincent and the GrenadinesSub-Saharan Africa Sub-Saharan Africa (excluding high income)Sub-Saharan Africa (IDA & IBRD countries)SudanSurinameSwazilandSwedenSwitzerlandTajikistanTanzaniaThailandTimor-LesteTogoTongaTrinidad and TobagoTunisiaTurkeyTurkmenistanUgandaUkraineUnited Arab EmiratesUnited KingdomUnited StatesUpper middle incomeUruguayUzbekistanVanuatuVenezuela, RBVietnamWest Bank and GazaWorldYemen, Rep.ZambiaZimbabwe Timeline:
This timeline shows a graph from 1973 to 2014 of Botswana. No data until 1972. Number of actual observations by date: 42.
Source name:
World Development Indicators
Source organization:
Carbon Dioxide Information Analysis Center, Environmental Sciences Division, Oak Ridge National Laboratory, Tennessee, United States.
Categories, topics:
Climate Change, Environment
Last updated:
apr 23, 2017
Indicators value changes by year
At the date of observation
Value
Absolute change
Change from previous value
jan 1, 1973
0.03
+0.03
0.0%
jan 1, 1974
0.057
+0.027
92.36%
jan 1, 1975
0.09
+0.033
57.57%
jan 1, 1976
0.176
+0.086
95.95%
jan 1, 1977
0.505
+0.329
187.08%
jan 1, 1978
0.592
+0.088
17.38%
jan 1, 1979
0.552
-0.04
-6.79%
jan 1, 1980
0.557
+0.005
0.95%
jan 1, 1981
0.521
-0.036
-6.53%
jan 1, 1982
0.488
-0.033
-6.27%
jan 1, 1983
0.475
-0.013
-2.74%
jan 1, 1984
0.393
-0.082
-17.22%
jan 1, 1985
0.367
-0.026
-6.56%
jan 1, 1986
0.38
+0.013
3.5%
jan 1, 1987
0.324
-0.057
-14.87%
jan 1, 1988
0.336
+0.012
3.82%
jan 1, 1989
0.295
-0.041
-12.07%
jan 1, 1990
0.287
-0.008
-2.83%
jan 1, 1991
0.508
+0.221
76.99%
jan 1, 1992
0.461
-0.047
-9.21%
jan 1, 1993
0.473
+0.011
2.44%
jan 1, 1994
0.533
+0.061
12.88%
jan 1, 1995
0.488
-0.045
-8.48%
jan 1, 1996
0.458
-0.03
-6.12%
jan 1, 1997
0.392
-0.066
-14.49%
jan 1, 1998
0.369
-0.023
-5.95%
jan 1, 1999
0.437
+0.068
18.52%
jan 1, 2000
0.376
-0.06
-13.81%
jan 1, 2001
0.441
+0.065
17.27%
jan 1, 2002
0.448
+0.007
1.59%
jan 1, 2003
0.437
-0.012
-2.58%
jan 1, 2004
0.402
-0.035
-8.03%
jan 1, 2005
0.398
-0.003
-0.86%
jan 1, 2006
0.4
+0.002
0.5%
jan 1, 2007
0.373
-0.027
-6.81%
jan 1, 2008
0.353
-0.021
-5.52%
jan 1, 2009
0.353
+0.001
0.24%
jan 1, 2010
0.333
-0.02
-5.63%
jan 1, 2011
0.375
+0.042
12.5%
jan 1, 2012
0.325
-0.051
-13.49%
jan 1, 2013
0.314
-0.01
-3.23%
jan 1, 2014
0.349
+0.034
10.99%
Ranking of countries by current statistics by years


Comments: