29
/
en
AIzaSyAYiBZKx7MnpbEhh9jyipgxe19OcubqV5w
April 1, 2024
76921
Bahrain
BHR
true
2
1
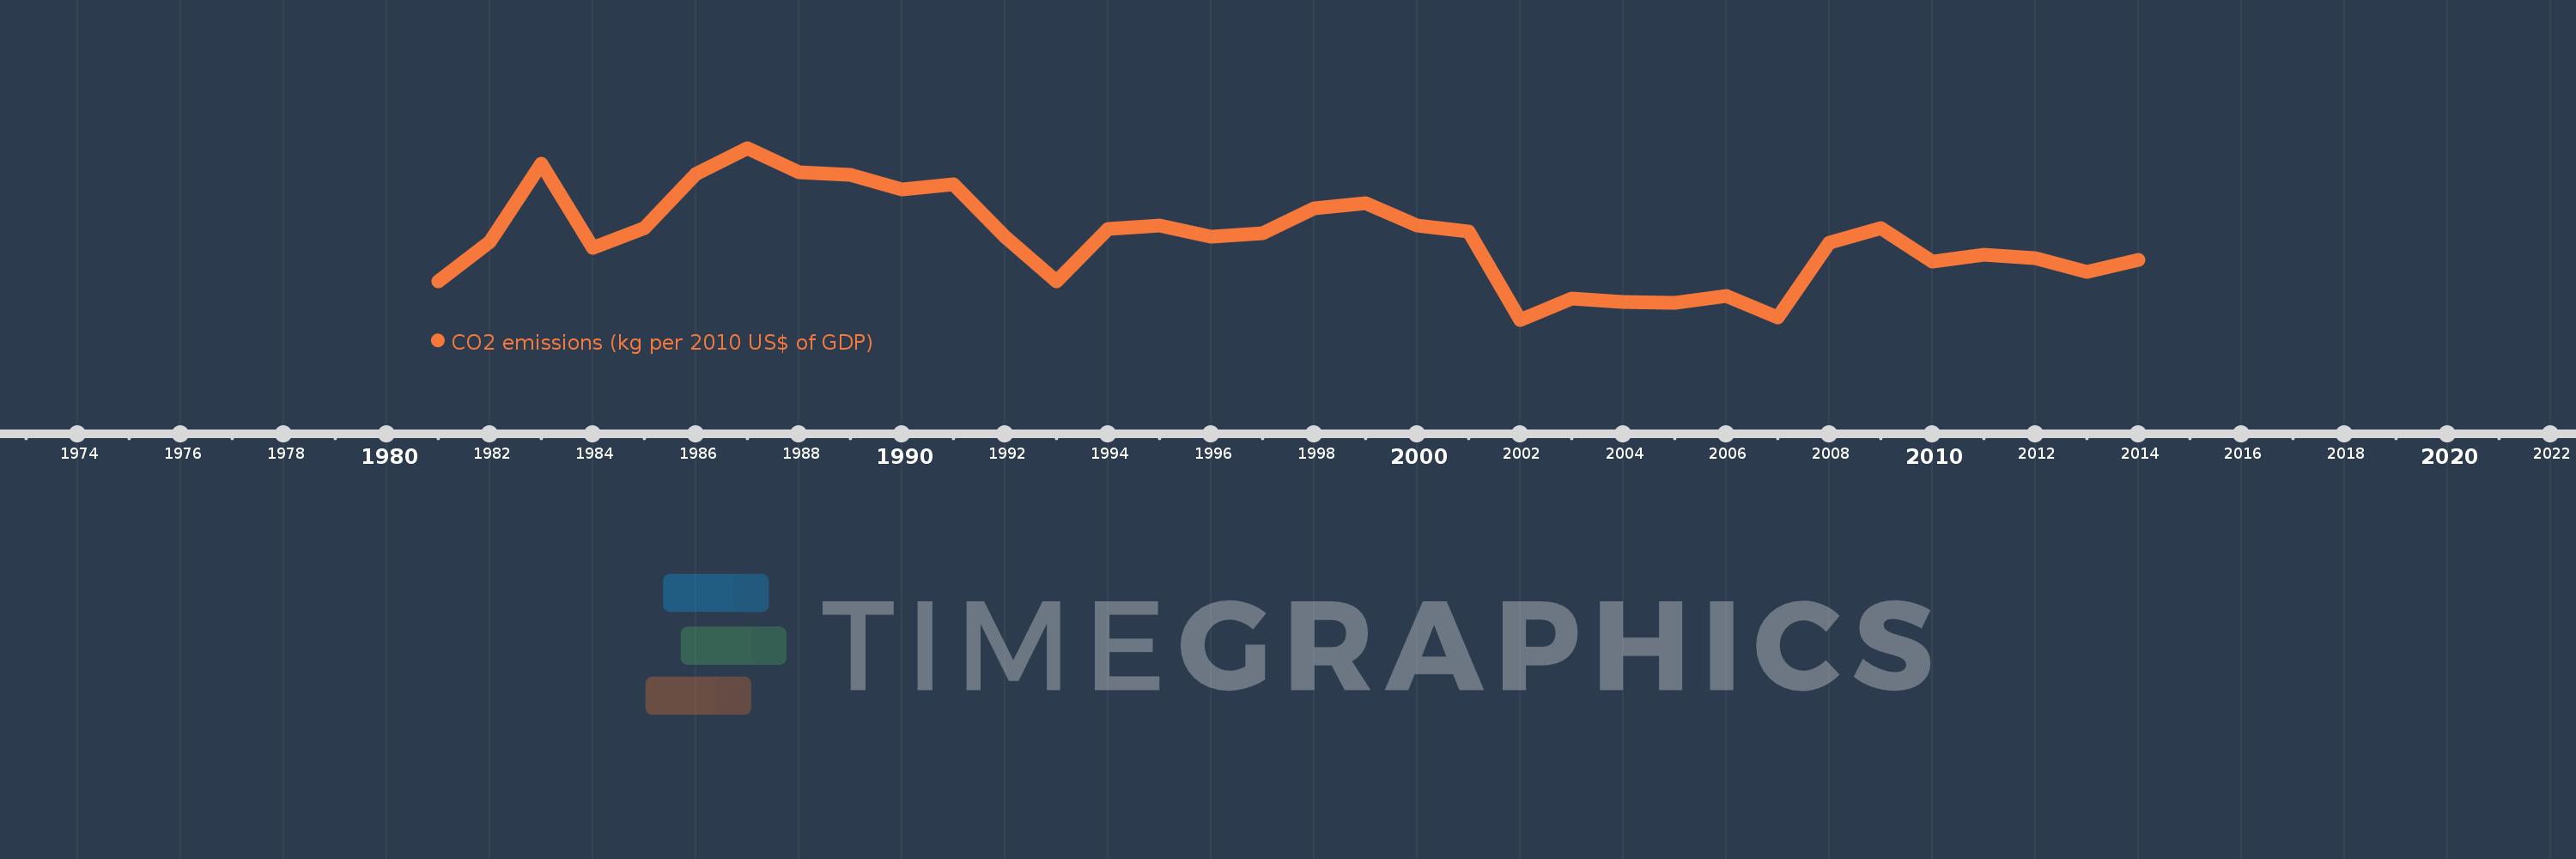
CO2 emissions (kg per 2010 US$ of GDP)
2014,2013,2012,2011,2010,2009,2008,2007,2006,2005,2004,2003,2002,2001,2000,1999,1998,1997,1996,1995,1994,1993,1992,1991,1990,1989,1988,1987,1986,1985,1984,1983,1982,1981
This statistics in other country:
AfghanistanAlbaniaAlgeriaAndorraAngolaAntigua and BarbudaArab WorldArgentinaArmeniaArubaAustraliaAustriaAzerbaijanBahamas, TheBahrainBangladeshBarbadosBelarusBelgiumBelizeBeninBermudaBhutanBoliviaBosnia and HerzegovinaBotswanaBrazilBrunei DarussalamBulgariaBurkina FasoBurundiCabo VerdeCambodiaCameroonCanadaCaribbean small statesCentral African RepublicCentral Europe and the BalticsChadChileChinaColombiaComorosCongo, Dem. Rep.Congo, Rep.Costa RicaCote d'IvoireCroatiaCubaCyprusCzech RepublicDenmarkDjiboutiDominicaDominican RepublicEarly-demographic dividendEast Asia & PacificEast Asia & Pacific (excluding high income)East Asia & Pacific (IDA & IBRD countries)EcuadorEgypt, Arab Rep.El SalvadorEquatorial GuineaEritreaEstoniaEthiopiaEuro areaEurope & Central AsiaEurope & Central Asia (excluding high income)Europe & Central Asia (IDA & IBRD countries)European UnionFaroe IslandsFijiFinlandFragile and conflict affected situationsFranceGabonGambia, TheGeorgiaGermanyGhanaGreeceGreenlandGrenadaGuatemalaGuineaGuinea-BissauGuyanaHaitiHeavily indebted poor countries (HIPC)High incomeHondurasHong Kong SAR, ChinaHungaryIBRD onlyIcelandIDA & IBRD totalIDA blendIDA onlyIDA totalIndiaIndonesiaIran, Islamic Rep.IraqIrelandIsraelItalyJamaicaJapanJordanKazakhstanKenyaKiribatiKorea, Rep.KuwaitKyrgyz RepublicLao PDRLate-demographic dividendLatin America & Caribbean Latin America & Caribbean (excluding high income)Latin America & the Caribbean (IDA & IBRD countries)LatviaLeast developed countries: UN classificationLebanonLesothoLiberiaLibyaLiechtensteinLithuaniaLow & middle incomeLow incomeLower middle incomeLuxembourgMacao SAR, ChinaMacedonia, FYRMadagascarMalawiMalaysiaMaldivesMaliMaltaMarshall IslandsMauritaniaMauritiusMexicoMicronesia, Fed. Sts.Middle East & North AfricaMiddle East & North Africa (excluding high income)Middle East & North Africa (IDA & IBRD countries)Middle incomeMoldovaMongoliaMontenegroMoroccoMozambiqueMyanmarNamibiaNauruNepalNetherlandsNew ZealandNicaraguaNigerNigeriaNorth AmericaNorwayOECD membersOmanOther small statesPacific island small statesPakistanPalauPanamaPapua New GuineaParaguayPeruPhilippinesPolandPortugalPost-demographic dividendPre-demographic dividendQatarRomaniaRussian FederationRwandaSamoaSao Tome and PrincipeSaudi ArabiaSenegalSerbiaSeychellesSierra LeoneSingaporeSlovak RepublicSloveniaSmall statesSolomon IslandsSouth AfricaSouth AsiaSouth Asia (IDA & IBRD)South SudanSpainSri LankaSt. Kitts and NevisSt. LuciaSt. Vincent and the GrenadinesSub-Saharan Africa Sub-Saharan Africa (excluding high income)Sub-Saharan Africa (IDA & IBRD countries)SudanSurinameSwazilandSwedenSwitzerlandTajikistanTanzaniaThailandTimor-LesteTogoTongaTrinidad and TobagoTunisiaTurkeyTurkmenistanUgandaUkraineUnited Arab EmiratesUnited KingdomUnited StatesUpper middle incomeUruguayUzbekistanVanuatuVenezuela, RBVietnamWest Bank and GazaWorldYemen, Rep.ZambiaZimbabwe Timeline:
This timeline shows a graph from 1981 to 2014 of Bahrain. No data until 1980. Number of actual observations by date: 34.
Source name:
World Development Indicators
Source organization:
Carbon Dioxide Information Analysis Center, Environmental Sciences Division, Oak Ridge National Laboratory, Tennessee, United States.
Categories, topics:
Climate Change, Environment
Last updated:
apr 23, 2017
Indicators value changes by year
At the date of observation
Value
Absolute change
Change from previous value
jan 1, 1981
1.035
+1.035
0.0%
jan 1, 1982
1.181
+0.146
14.16%
jan 1, 1983
1.474
+0.293
24.83%
jan 1, 1984
1.159
-0.315
-21.38%
jan 1, 1985
1.235
+0.076
6.57%
jan 1, 1986
1.436
+0.201
16.24%
jan 1, 1987
1.533
+0.097
6.76%
jan 1, 1988
1.441
-0.092
-5.98%
jan 1, 1989
1.433
-0.008
-0.55%
jan 1, 1990
1.378
-0.055
-3.85%
jan 1, 1991
1.397
+0.019
1.37%
jan 1, 1992
1.201
-0.197
-14.08%
jan 1, 1993
1.033
-0.168
-13.97%
jan 1, 1994
1.229
+0.196
18.99%
jan 1, 1995
1.244
+0.015
1.25%
jan 1, 1996
1.2
-0.045
-3.59%
jan 1, 1997
1.215
+0.015
1.26%
jan 1, 1998
1.307
+0.092
7.54%
jan 1, 1999
1.325
+0.018
1.41%
jan 1, 2000
1.244
-0.081
-6.13%
jan 1, 2001
1.222
-0.022
-1.75%
jan 1, 2002
0.891
-0.331
-27.11%
jan 1, 2003
0.969
+0.078
8.79%
jan 1, 2004
0.959
-0.01
-1.06%
jan 1, 2005
0.953
-0.006
-0.61%
jan 1, 2006
0.979
+0.026
2.74%
jan 1, 2007
0.901
-0.078
-7.92%
jan 1, 2008
1.18
+0.279
30.9%
jan 1, 2009
1.232
+0.052
4.41%
jan 1, 2010
1.108
-0.124
-10.07%
jan 1, 2011
1.133
+0.025
2.28%
jan 1, 2012
1.12
-0.013
-1.18%
jan 1, 2013
1.069
-0.05
-4.51%
jan 1, 2014
1.115
+0.045
4.23%
Ranking of countries by current statistics by years


Comments: