29
/
en
AIzaSyAYiBZKx7MnpbEhh9jyipgxe19OcubqV5w
April 1, 2024
253940
Suriname
SUR
true
2
1
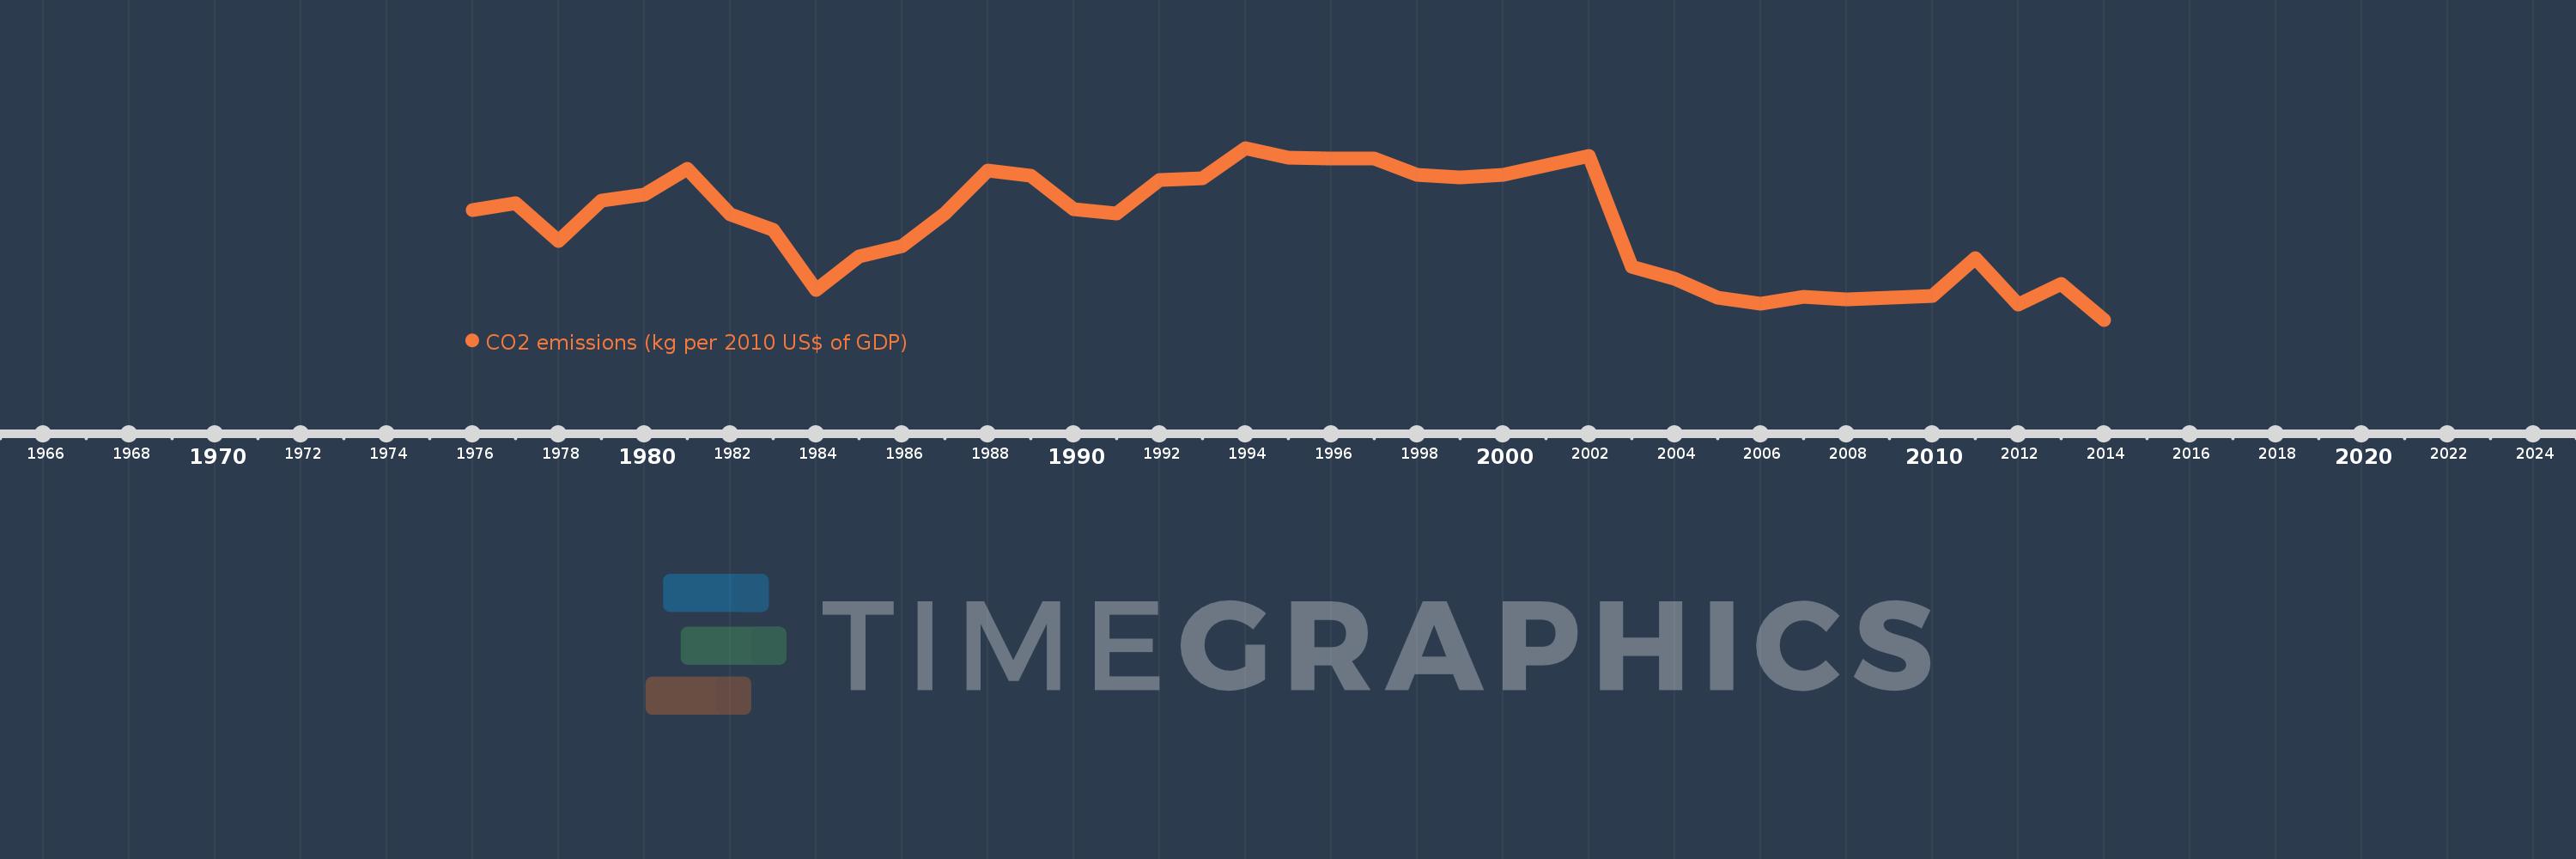
CO2 emissions (kg per 2010 US$ of GDP)
2014,2013,2012,2011,2010,2009,2008,2007,2006,2005,2004,2003,2002,2001,2000,1999,1998,1997,1996,1995,1994,1993,1992,1991,1990,1989,1988,1987,1986,1985,1984,1983,1982,1981,1980,1979,1978,1977,1976
This statistics in other country:
AfghanistanAlbaniaAlgeriaAndorraAngolaAntigua and BarbudaArab WorldArgentinaArmeniaArubaAustraliaAustriaAzerbaijanBahamas, TheBahrainBangladeshBarbadosBelarusBelgiumBelizeBeninBermudaBhutanBoliviaBosnia and HerzegovinaBotswanaBrazilBrunei DarussalamBulgariaBurkina FasoBurundiCabo VerdeCambodiaCameroonCanadaCaribbean small statesCentral African RepublicCentral Europe and the BalticsChadChileChinaColombiaComorosCongo, Dem. Rep.Congo, Rep.Costa RicaCote d'IvoireCroatiaCubaCyprusCzech RepublicDenmarkDjiboutiDominicaDominican RepublicEarly-demographic dividendEast Asia & PacificEast Asia & Pacific (excluding high income)East Asia & Pacific (IDA & IBRD countries)EcuadorEgypt, Arab Rep.El SalvadorEquatorial GuineaEritreaEstoniaEthiopiaEuro areaEurope & Central AsiaEurope & Central Asia (excluding high income)Europe & Central Asia (IDA & IBRD countries)European UnionFaroe IslandsFijiFinlandFragile and conflict affected situationsFranceGabonGambia, TheGeorgiaGermanyGhanaGreeceGreenlandGrenadaGuatemalaGuineaGuinea-BissauGuyanaHaitiHeavily indebted poor countries (HIPC)High incomeHondurasHong Kong SAR, ChinaHungaryIBRD onlyIcelandIDA & IBRD totalIDA blendIDA onlyIDA totalIndiaIndonesiaIran, Islamic Rep.IraqIrelandIsraelItalyJamaicaJapanJordanKazakhstanKenyaKiribatiKorea, Rep.KuwaitKyrgyz RepublicLao PDRLate-demographic dividendLatin America & Caribbean Latin America & Caribbean (excluding high income)Latin America & the Caribbean (IDA & IBRD countries)LatviaLeast developed countries: UN classificationLebanonLesothoLiberiaLibyaLiechtensteinLithuaniaLow & middle incomeLow incomeLower middle incomeLuxembourgMacao SAR, ChinaMacedonia, FYRMadagascarMalawiMalaysiaMaldivesMaliMaltaMarshall IslandsMauritaniaMauritiusMexicoMicronesia, Fed. Sts.Middle East & North AfricaMiddle East & North Africa (excluding high income)Middle East & North Africa (IDA & IBRD countries)Middle incomeMoldovaMongoliaMontenegroMoroccoMozambiqueMyanmarNamibiaNauruNepalNetherlandsNew ZealandNicaraguaNigerNigeriaNorth AmericaNorwayOECD membersOmanOther small statesPacific island small statesPakistanPalauPanamaPapua New GuineaParaguayPeruPhilippinesPolandPortugalPost-demographic dividendPre-demographic dividendQatarRomaniaRussian FederationRwandaSamoaSao Tome and PrincipeSaudi ArabiaSenegalSerbiaSeychellesSierra LeoneSingaporeSlovak RepublicSloveniaSmall statesSolomon IslandsSouth AfricaSouth AsiaSouth Asia (IDA & IBRD)South SudanSpainSri LankaSt. Kitts and NevisSt. LuciaSt. Vincent and the GrenadinesSub-Saharan Africa Sub-Saharan Africa (excluding high income)Sub-Saharan Africa (IDA & IBRD countries)SudanSurinameSwazilandSwedenSwitzerlandTajikistanTanzaniaThailandTimor-LesteTogoTongaTrinidad and TobagoTunisiaTurkeyTurkmenistanUgandaUkraineUnited Arab EmiratesUnited KingdomUnited StatesUpper middle incomeUruguayUzbekistanVanuatuVenezuela, RBVietnamWest Bank and GazaWorldYemen, Rep.ZambiaZimbabwe Timeline:
This timeline shows a graph from 1976 to 2014 of Suriname. No data until 1975. Number of actual observations by date: 39.
Source name:
World Development Indicators
Source organization:
Carbon Dioxide Information Analysis Center, Environmental Sciences Division, Oak Ridge National Laboratory, Tennessee, United States.
Categories, topics:
Climate Change, Environment
Last updated:
apr 23, 2017
Indicators value changes by year
At the date of observation
Value
Absolute change
Change from previous value
jan 1, 1976
0.732
+0.732
0.0%
jan 1, 1977
0.751
+0.019
2.58%
jan 1, 1978
0.648
-0.103
-13.67%
jan 1, 1979
0.759
+0.111
17.14%
jan 1, 1980
0.775
+0.015
2.01%
jan 1, 1981
0.845
+0.07
9.03%
jan 1, 1982
0.721
-0.123
-14.59%
jan 1, 1983
0.679
-0.042
-5.86%
jan 1, 1984
0.514
-0.165
-24.31%
jan 1, 1985
0.605
+0.091
17.66%
jan 1, 1986
0.634
+0.029
4.78%
jan 1, 1987
0.723
+0.09
14.14%
jan 1, 1988
0.842
+0.119
16.5%
jan 1, 1989
0.826
-0.016
-1.94%
jan 1, 1990
0.735
-0.091
-10.98%
jan 1, 1991
0.722
-0.014
-1.89%
jan 1, 1992
0.814
+0.093
12.85%
jan 1, 1993
0.82
+0.006
0.73%
jan 1, 1994
0.903
+0.083
10.07%
jan 1, 1995
0.877
-0.025
-2.82%
jan 1, 1996
0.875
-0.002
-0.25%
jan 1, 1997
0.873
-0.002
-0.26%
jan 1, 1998
0.83
-0.043
-4.95%
jan 1, 1999
0.822
-0.007
-0.89%
jan 1, 2000
0.828
+0.006
0.71%
jan 1, 2001
0.856
+0.028
3.37%
jan 1, 2002
0.88
+0.024
2.81%
jan 1, 2003
0.577
-0.303
-34.42%
jan 1, 2004
0.544
-0.033
-5.67%
jan 1, 2005
0.492
-0.053
-9.66%
jan 1, 2006
0.475
-0.016
-3.32%
jan 1, 2007
0.495
+0.019
4.05%
jan 1, 2008
0.488
-0.007
-1.42%
jan 1, 2009
0.492
+0.004
0.87%
jan 1, 2010
0.496
+0.004
0.84%
jan 1, 2011
0.601
+0.105
21.15%
jan 1, 2012
0.472
-0.129
-21.46%
jan 1, 2013
0.529
+0.057
12.1%
jan 1, 2014
0.431
-0.098
-18.54%
Ranking of countries by current statistics by years


Comments: