29
/
en
AIzaSyAYiBZKx7MnpbEhh9jyipgxe19OcubqV5w
April 1, 2024
113337
Cote d'Ivoire
CIV
true
2
1
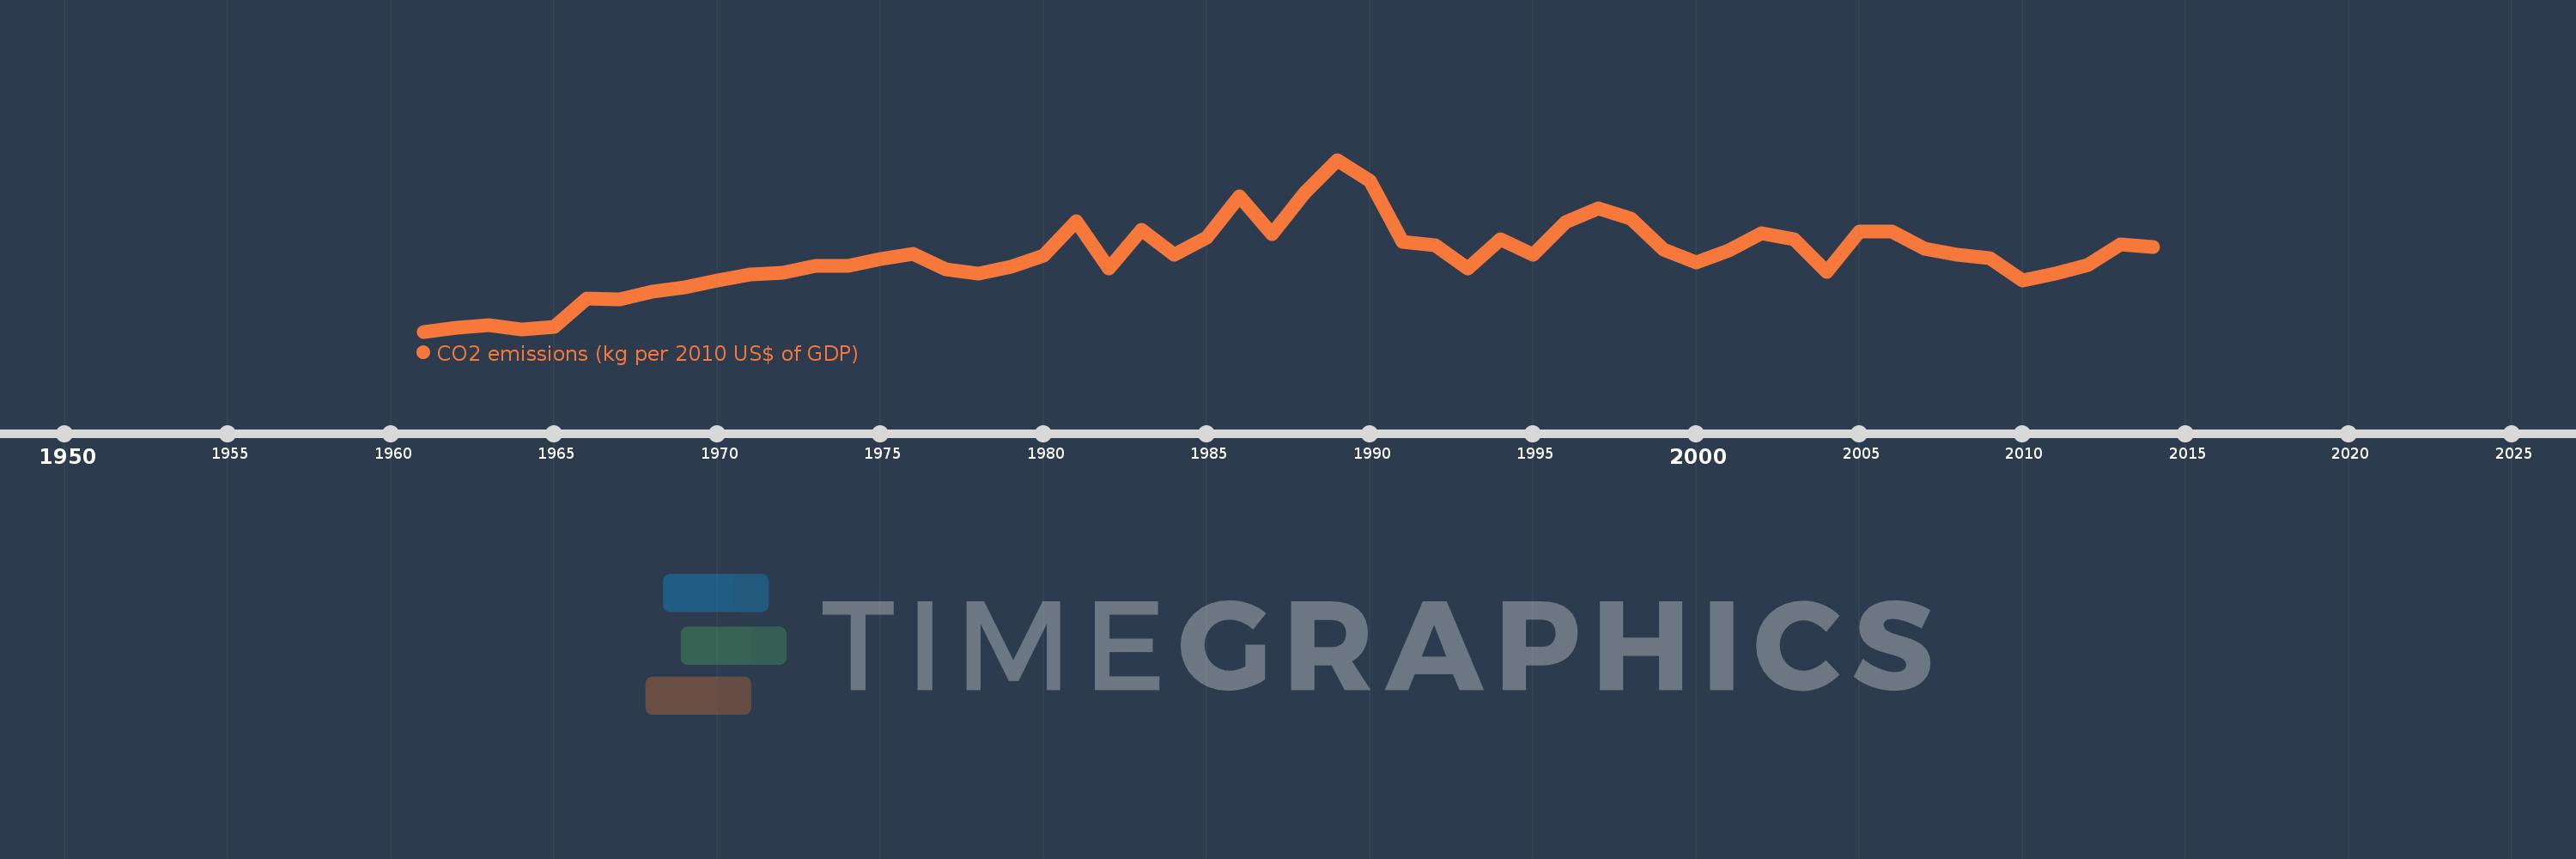
CO2 emissions (kg per 2010 US$ of GDP)
2014,2013,2012,2011,2010,2009,2008,2007,2006,2005,2004,2003,2002,2001,2000,1999,1998,1997,1996,1995,1994,1993,1992,1991,1990,1989,1988,1987,1986,1985,1984,1983,1982,1981,1980,1979,1978,1977,1976,1975,1974,1973,1972,1971,1970,1969,1968,1967,1966,1965,1964,1963,1962,1961
This statistics in other country:
AfghanistanAlbaniaAlgeriaAndorraAngolaAntigua and BarbudaArab WorldArgentinaArmeniaArubaAustraliaAustriaAzerbaijanBahamas, TheBahrainBangladeshBarbadosBelarusBelgiumBelizeBeninBermudaBhutanBoliviaBosnia and HerzegovinaBotswanaBrazilBrunei DarussalamBulgariaBurkina FasoBurundiCabo VerdeCambodiaCameroonCanadaCaribbean small statesCentral African RepublicCentral Europe and the BalticsChadChileChinaColombiaComorosCongo, Dem. Rep.Congo, Rep.Costa RicaCote d'IvoireCroatiaCubaCyprusCzech RepublicDenmarkDjiboutiDominicaDominican RepublicEarly-demographic dividendEast Asia & PacificEast Asia & Pacific (excluding high income)East Asia & Pacific (IDA & IBRD countries)EcuadorEgypt, Arab Rep.El SalvadorEquatorial GuineaEritreaEstoniaEthiopiaEuro areaEurope & Central AsiaEurope & Central Asia (excluding high income)Europe & Central Asia (IDA & IBRD countries)European UnionFaroe IslandsFijiFinlandFragile and conflict affected situationsFranceGabonGambia, TheGeorgiaGermanyGhanaGreeceGreenlandGrenadaGuatemalaGuineaGuinea-BissauGuyanaHaitiHeavily indebted poor countries (HIPC)High incomeHondurasHong Kong SAR, ChinaHungaryIBRD onlyIcelandIDA & IBRD totalIDA blendIDA onlyIDA totalIndiaIndonesiaIran, Islamic Rep.IraqIrelandIsraelItalyJamaicaJapanJordanKazakhstanKenyaKiribatiKorea, Rep.KuwaitKyrgyz RepublicLao PDRLate-demographic dividendLatin America & Caribbean Latin America & Caribbean (excluding high income)Latin America & the Caribbean (IDA & IBRD countries)LatviaLeast developed countries: UN classificationLebanonLesothoLiberiaLibyaLiechtensteinLithuaniaLow & middle incomeLow incomeLower middle incomeLuxembourgMacao SAR, ChinaMacedonia, FYRMadagascarMalawiMalaysiaMaldivesMaliMaltaMarshall IslandsMauritaniaMauritiusMexicoMicronesia, Fed. Sts.Middle East & North AfricaMiddle East & North Africa (excluding high income)Middle East & North Africa (IDA & IBRD countries)Middle incomeMoldovaMongoliaMontenegroMoroccoMozambiqueMyanmarNamibiaNauruNepalNetherlandsNew ZealandNicaraguaNigerNigeriaNorth AmericaNorwayOECD membersOmanOther small statesPacific island small statesPakistanPalauPanamaPapua New GuineaParaguayPeruPhilippinesPolandPortugalPost-demographic dividendPre-demographic dividendQatarRomaniaRussian FederationRwandaSamoaSao Tome and PrincipeSaudi ArabiaSenegalSerbiaSeychellesSierra LeoneSingaporeSlovak RepublicSloveniaSmall statesSolomon IslandsSouth AfricaSouth AsiaSouth Asia (IDA & IBRD)South SudanSpainSri LankaSt. Kitts and NevisSt. LuciaSt. Vincent and the GrenadinesSub-Saharan Africa Sub-Saharan Africa (excluding high income)Sub-Saharan Africa (IDA & IBRD countries)SudanSurinameSwazilandSwedenSwitzerlandTajikistanTanzaniaThailandTimor-LesteTogoTongaTrinidad and TobagoTunisiaTurkeyTurkmenistanUgandaUkraineUnited Arab EmiratesUnited KingdomUnited StatesUpper middle incomeUruguayUzbekistanVanuatuVenezuela, RBVietnamWest Bank and GazaWorldYemen, Rep.ZambiaZimbabwe Timeline:
This timeline shows a graph from 1961 to 2014 of Cote d'Ivoire. No data until 1960. Number of actual observations by date: 54.
Source name:
World Development Indicators
Source organization:
Carbon Dioxide Information Analysis Center, Environmental Sciences Division, Oak Ridge National Laboratory, Tennessee, United States.
Categories, topics:
Climate Change, Environment
Last updated:
apr 23, 2017
Indicators value changes by year
At the date of observation
Value
Absolute change
Change from previous value
jan 1, 1961
0.108
+0.108
0.0%
jan 1, 1962
0.117
+0.01
9.01%
jan 1, 1963
0.123
+0.005
4.68%
jan 1, 1964
0.114
-0.009
-7.2%
jan 1, 1965
0.119
+0.005
4.03%
jan 1, 1966
0.188
+0.07
58.78%
jan 1, 1967
0.186
-0.002
-1.13%
jan 1, 1968
0.205
+0.019
9.96%
jan 1, 1969
0.216
+0.011
5.26%
jan 1, 1970
0.233
+0.017
7.99%
jan 1, 1971
0.247
+0.014
6.05%
jan 1, 1972
0.25
+0.003
1.24%
jan 1, 1973
0.267
+0.017
6.86%
jan 1, 1974
0.268
+0.001
0.48%
jan 1, 1975
0.285
+0.017
6.37%
jan 1, 1976
0.296
+0.01
3.51%
jan 1, 1977
0.26
-0.035
-12.01%
jan 1, 1978
0.248
-0.012
-4.66%
jan 1, 1979
0.266
+0.018
7.12%
jan 1, 1980
0.292
+0.026
9.93%
jan 1, 1981
0.376
+0.084
28.86%
jan 1, 1982
0.261
-0.115
-30.65%
jan 1, 1983
0.356
+0.095
36.51%
jan 1, 1984
0.294
-0.063
-17.55%
jan 1, 1985
0.337
+0.043
14.77%
jan 1, 1986
0.437
+0.1
29.71%
jan 1, 1987
0.345
-0.092
-21.14%
jan 1, 1988
0.445
+0.101
29.22%
jan 1, 1989
0.525
+0.08
17.9%
jan 1, 1990
0.474
-0.051
-9.63%
jan 1, 1991
0.325
-0.15
-31.56%
jan 1, 1992
0.317
-0.008
-2.33%
jan 1, 1993
0.261
-0.056
-17.76%
jan 1, 1994
0.333
+0.072
27.68%
jan 1, 1995
0.294
-0.039
-11.61%
jan 1, 1996
0.373
+0.079
26.79%
jan 1, 1997
0.407
+0.034
9.05%
jan 1, 1998
0.383
-0.024
-5.97%
jan 1, 1999
0.308
-0.074
-19.41%
jan 1, 2000
0.275
-0.033
-10.78%
jan 1, 2001
0.305
+0.029
10.66%
jan 1, 2002
0.346
+0.042
13.63%
jan 1, 2003
0.332
-0.014
-4.1%
jan 1, 2004
0.252
-0.08
-24.03%
jan 1, 2005
0.35
+0.097
38.65%
jan 1, 2006
0.351
+0.001
0.38%
jan 1, 2007
0.309
-0.042
-11.93%
jan 1, 2008
0.294
-0.015
-4.82%
jan 1, 2009
0.287
-0.007
-2.48%
jan 1, 2010
0.232
-0.055
-19.13%
jan 1, 2011
0.248
+0.016
6.79%
jan 1, 2012
0.269
+0.021
8.57%
jan 1, 2013
0.319
+0.05
18.44%
jan 1, 2014
0.313
-0.005
-1.62%
Ranking of countries by current statistics by years


Comments: