29
/
en
AIzaSyAYiBZKx7MnpbEhh9jyipgxe19OcubqV5w
April 1, 2024
133904
France
FRA
true
2
1
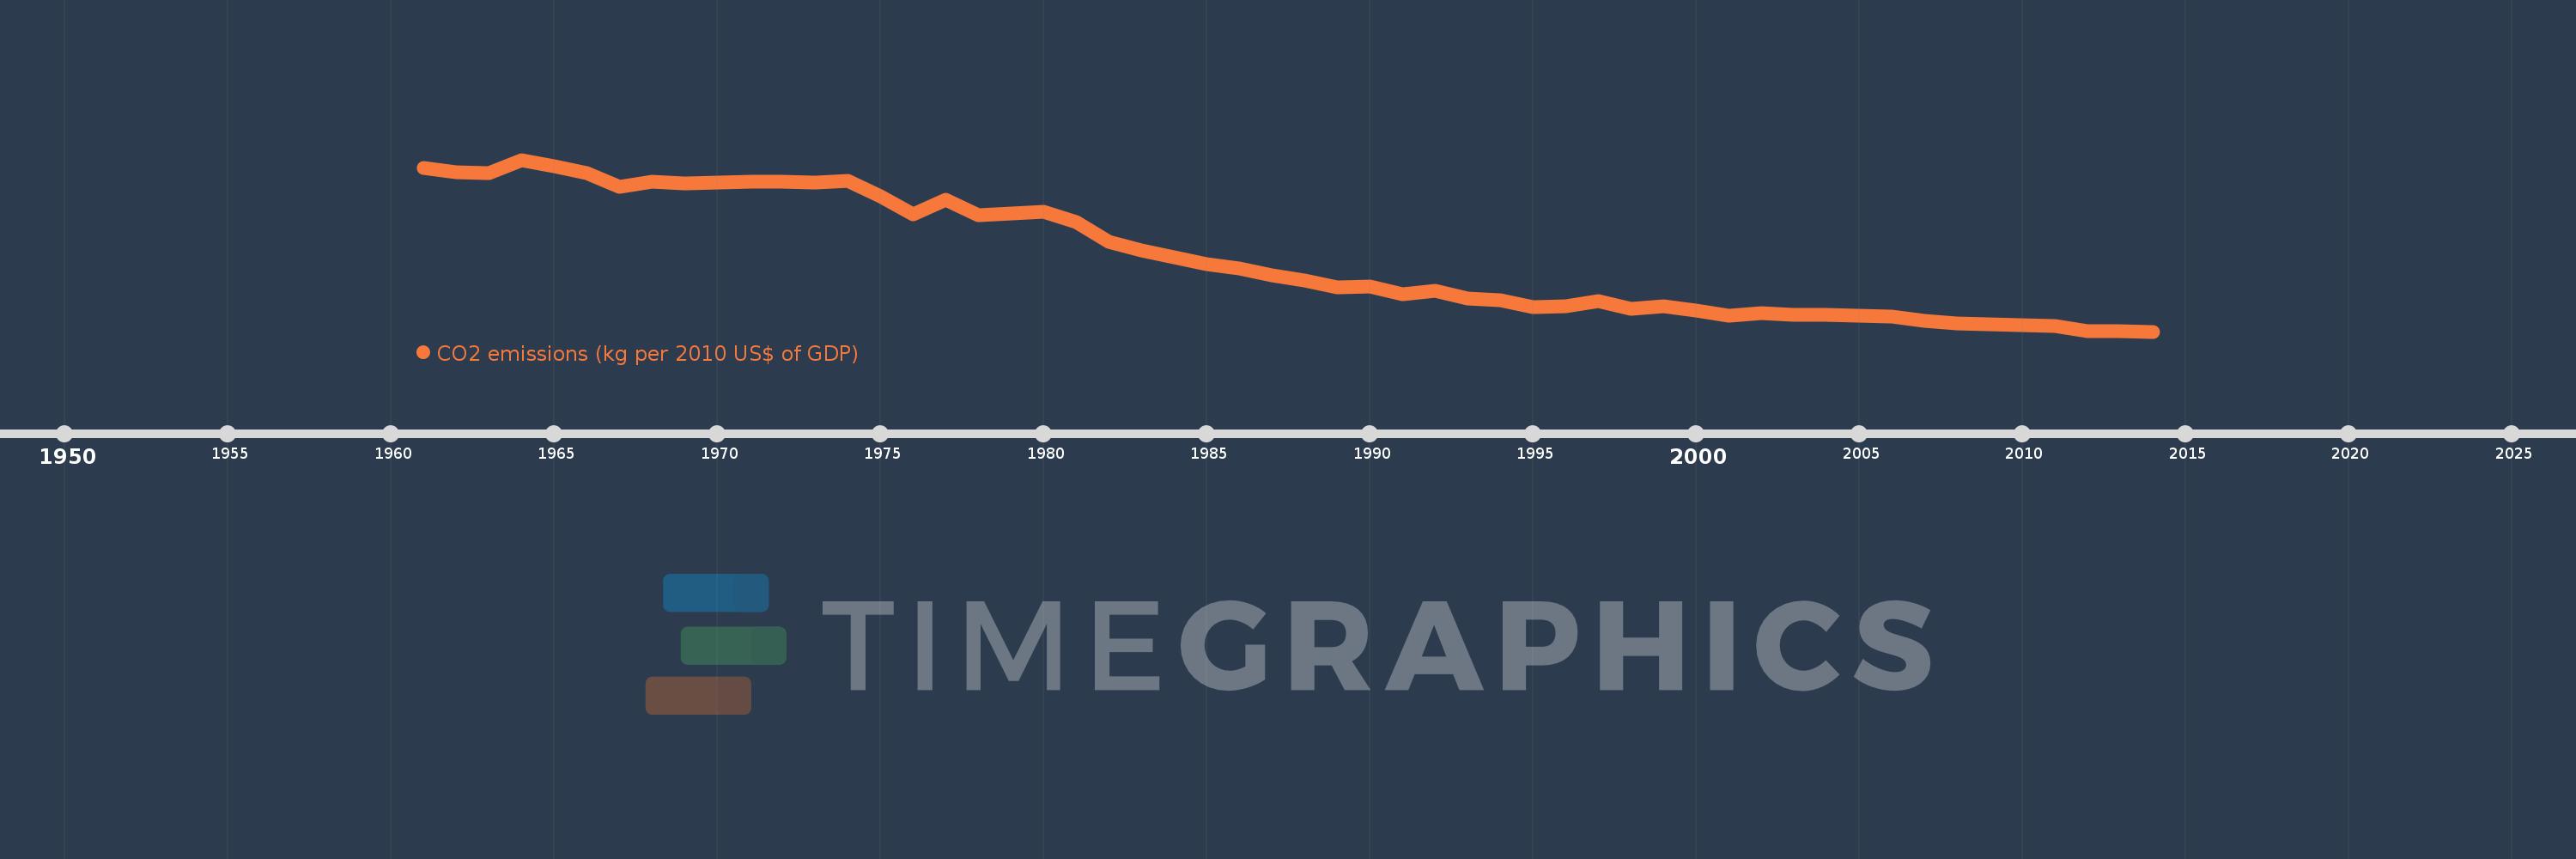
CO2 emissions (kg per 2010 US$ of GDP)
2014,2013,2012,2011,2010,2009,2008,2007,2006,2005,2004,2003,2002,2001,2000,1999,1998,1997,1996,1995,1994,1993,1992,1991,1990,1989,1988,1987,1986,1985,1984,1983,1982,1981,1980,1979,1978,1977,1976,1975,1974,1973,1972,1971,1970,1969,1968,1967,1966,1965,1964,1963,1962,1961
This statistics in other country:
AfghanistanAlbaniaAlgeriaAndorraAngolaAntigua and BarbudaArab WorldArgentinaArmeniaArubaAustraliaAustriaAzerbaijanBahamas, TheBahrainBangladeshBarbadosBelarusBelgiumBelizeBeninBermudaBhutanBoliviaBosnia and HerzegovinaBotswanaBrazilBrunei DarussalamBulgariaBurkina FasoBurundiCabo VerdeCambodiaCameroonCanadaCaribbean small statesCentral African RepublicCentral Europe and the BalticsChadChileChinaColombiaComorosCongo, Dem. Rep.Congo, Rep.Costa RicaCote d'IvoireCroatiaCubaCyprusCzech RepublicDenmarkDjiboutiDominicaDominican RepublicEarly-demographic dividendEast Asia & PacificEast Asia & Pacific (excluding high income)East Asia & Pacific (IDA & IBRD countries)EcuadorEgypt, Arab Rep.El SalvadorEquatorial GuineaEritreaEstoniaEthiopiaEuro areaEurope & Central AsiaEurope & Central Asia (excluding high income)Europe & Central Asia (IDA & IBRD countries)European UnionFaroe IslandsFijiFinlandFragile and conflict affected situationsFranceGabonGambia, TheGeorgiaGermanyGhanaGreeceGreenlandGrenadaGuatemalaGuineaGuinea-BissauGuyanaHaitiHeavily indebted poor countries (HIPC)High incomeHondurasHong Kong SAR, ChinaHungaryIBRD onlyIcelandIDA & IBRD totalIDA blendIDA onlyIDA totalIndiaIndonesiaIran, Islamic Rep.IraqIrelandIsraelItalyJamaicaJapanJordanKazakhstanKenyaKiribatiKorea, Rep.KuwaitKyrgyz RepublicLao PDRLate-demographic dividendLatin America & Caribbean Latin America & Caribbean (excluding high income)Latin America & the Caribbean (IDA & IBRD countries)LatviaLeast developed countries: UN classificationLebanonLesothoLiberiaLibyaLiechtensteinLithuaniaLow & middle incomeLow incomeLower middle incomeLuxembourgMacao SAR, ChinaMacedonia, FYRMadagascarMalawiMalaysiaMaldivesMaliMaltaMarshall IslandsMauritaniaMauritiusMexicoMicronesia, Fed. Sts.Middle East & North AfricaMiddle East & North Africa (excluding high income)Middle East & North Africa (IDA & IBRD countries)Middle incomeMoldovaMongoliaMontenegroMoroccoMozambiqueMyanmarNamibiaNauruNepalNetherlandsNew ZealandNicaraguaNigerNigeriaNorth AmericaNorwayOECD membersOmanOther small statesPacific island small statesPakistanPalauPanamaPapua New GuineaParaguayPeruPhilippinesPolandPortugalPost-demographic dividendPre-demographic dividendQatarRomaniaRussian FederationRwandaSamoaSao Tome and PrincipeSaudi ArabiaSenegalSerbiaSeychellesSierra LeoneSingaporeSlovak RepublicSloveniaSmall statesSolomon IslandsSouth AfricaSouth AsiaSouth Asia (IDA & IBRD)South SudanSpainSri LankaSt. Kitts and NevisSt. LuciaSt. Vincent and the GrenadinesSub-Saharan Africa Sub-Saharan Africa (excluding high income)Sub-Saharan Africa (IDA & IBRD countries)SudanSurinameSwazilandSwedenSwitzerlandTajikistanTanzaniaThailandTimor-LesteTogoTongaTrinidad and TobagoTunisiaTurkeyTurkmenistanUgandaUkraineUnited Arab EmiratesUnited KingdomUnited StatesUpper middle incomeUruguayUzbekistanVanuatuVenezuela, RBVietnamWest Bank and GazaWorldYemen, Rep.ZambiaZimbabwe Timeline:
This timeline shows a graph from 1961 to 2014 of France. No data until 1960. Number of actual observations by date: 54.
Source name:
World Development Indicators
Source organization:
Carbon Dioxide Information Analysis Center, Environmental Sciences Division, Oak Ridge National Laboratory, Tennessee, United States.
Categories, topics:
Climate Change, Environment
Last updated:
apr 23, 2017
Indicators value changes by year
At the date of observation
Value
Absolute change
Change from previous value
jan 1, 1961
0.446
+0.446
0.0%
jan 1, 1962
0.438
-0.008
-1.73%
jan 1, 1963
0.436
-0.002
-0.42%
jan 1, 1964
0.463
+0.027
6.15%
jan 1, 1965
0.45
-0.014
-2.95%
jan 1, 1966
0.437
-0.012
-2.75%
jan 1, 1967
0.41
-0.027
-6.2%
jan 1, 1968
0.42
+0.01
2.34%
jan 1, 1969
0.416
-0.003
-0.83%
jan 1, 1970
0.418
+0.002
0.42%
jan 1, 1971
0.42
+0.002
0.48%
jan 1, 1972
0.42
0.0
-0.01%
jan 1, 1973
0.418
-0.002
-0.56%
jan 1, 1974
0.422
+0.005
1.08%
jan 1, 1975
0.391
-0.031
-7.37%
jan 1, 1976
0.354
-0.037
-9.56%
jan 1, 1977
0.383
+0.03
8.45%
jan 1, 1978
0.353
-0.031
-8.07%
jan 1, 1979
0.357
+0.004
1.17%
jan 1, 1980
0.36
+0.004
1.01%
jan 1, 1981
0.339
-0.022
-5.99%
jan 1, 1982
0.301
-0.037
-10.98%
jan 1, 1983
0.283
-0.019
-6.27%
jan 1, 1984
0.27
-0.013
-4.47%
jan 1, 1985
0.255
-0.015
-5.52%
jan 1, 1986
0.248
-0.007
-2.68%
jan 1, 1987
0.233
-0.015
-6.02%
jan 1, 1988
0.223
-0.011
-4.57%
jan 1, 1989
0.21
-0.013
-5.86%
jan 1, 1990
0.211
+0.001
0.58%
jan 1, 1991
0.197
-0.014
-6.57%
jan 1, 1992
0.203
+0.006
2.92%
jan 1, 1993
0.187
-0.016
-7.83%
jan 1, 1994
0.185
-0.002
-1.02%
jan 1, 1995
0.17
-0.015
-8.2%
jan 1, 1996
0.172
+0.002
1.15%
jan 1, 1997
0.182
+0.01
6.02%
jan 1, 1998
0.167
-0.015
-8.47%
jan 1, 1999
0.173
+0.006
3.67%
jan 1, 2000
0.163
-0.009
-5.49%
jan 1, 2001
0.154
-0.009
-5.48%
jan 1, 2002
0.158
+0.003
2.23%
jan 1, 2003
0.155
-0.003
-1.75%
jan 1, 2004
0.156
+0.001
0.67%
jan 1, 2005
0.153
-0.003
-1.93%
jan 1, 2006
0.151
-0.002
-1.17%
jan 1, 2007
0.144
-0.007
-4.76%
jan 1, 2008
0.138
-0.006
-4.03%
jan 1, 2009
0.137
-0.001
-0.96%
jan 1, 2010
0.135
-0.001
-1.03%
jan 1, 2011
0.133
-0.002
-1.61%
jan 1, 2012
0.123
-0.011
-7.93%
jan 1, 2013
0.123
+0.0
0.24%
jan 1, 2014
0.122
-0.001
-0.5%
Ranking of countries by current statistics by years


Comments: