29
/
en
AIzaSyAYiBZKx7MnpbEhh9jyipgxe19OcubqV5w
April 1, 2024
26344
Early-demographic dividend
EAR
false
2
1
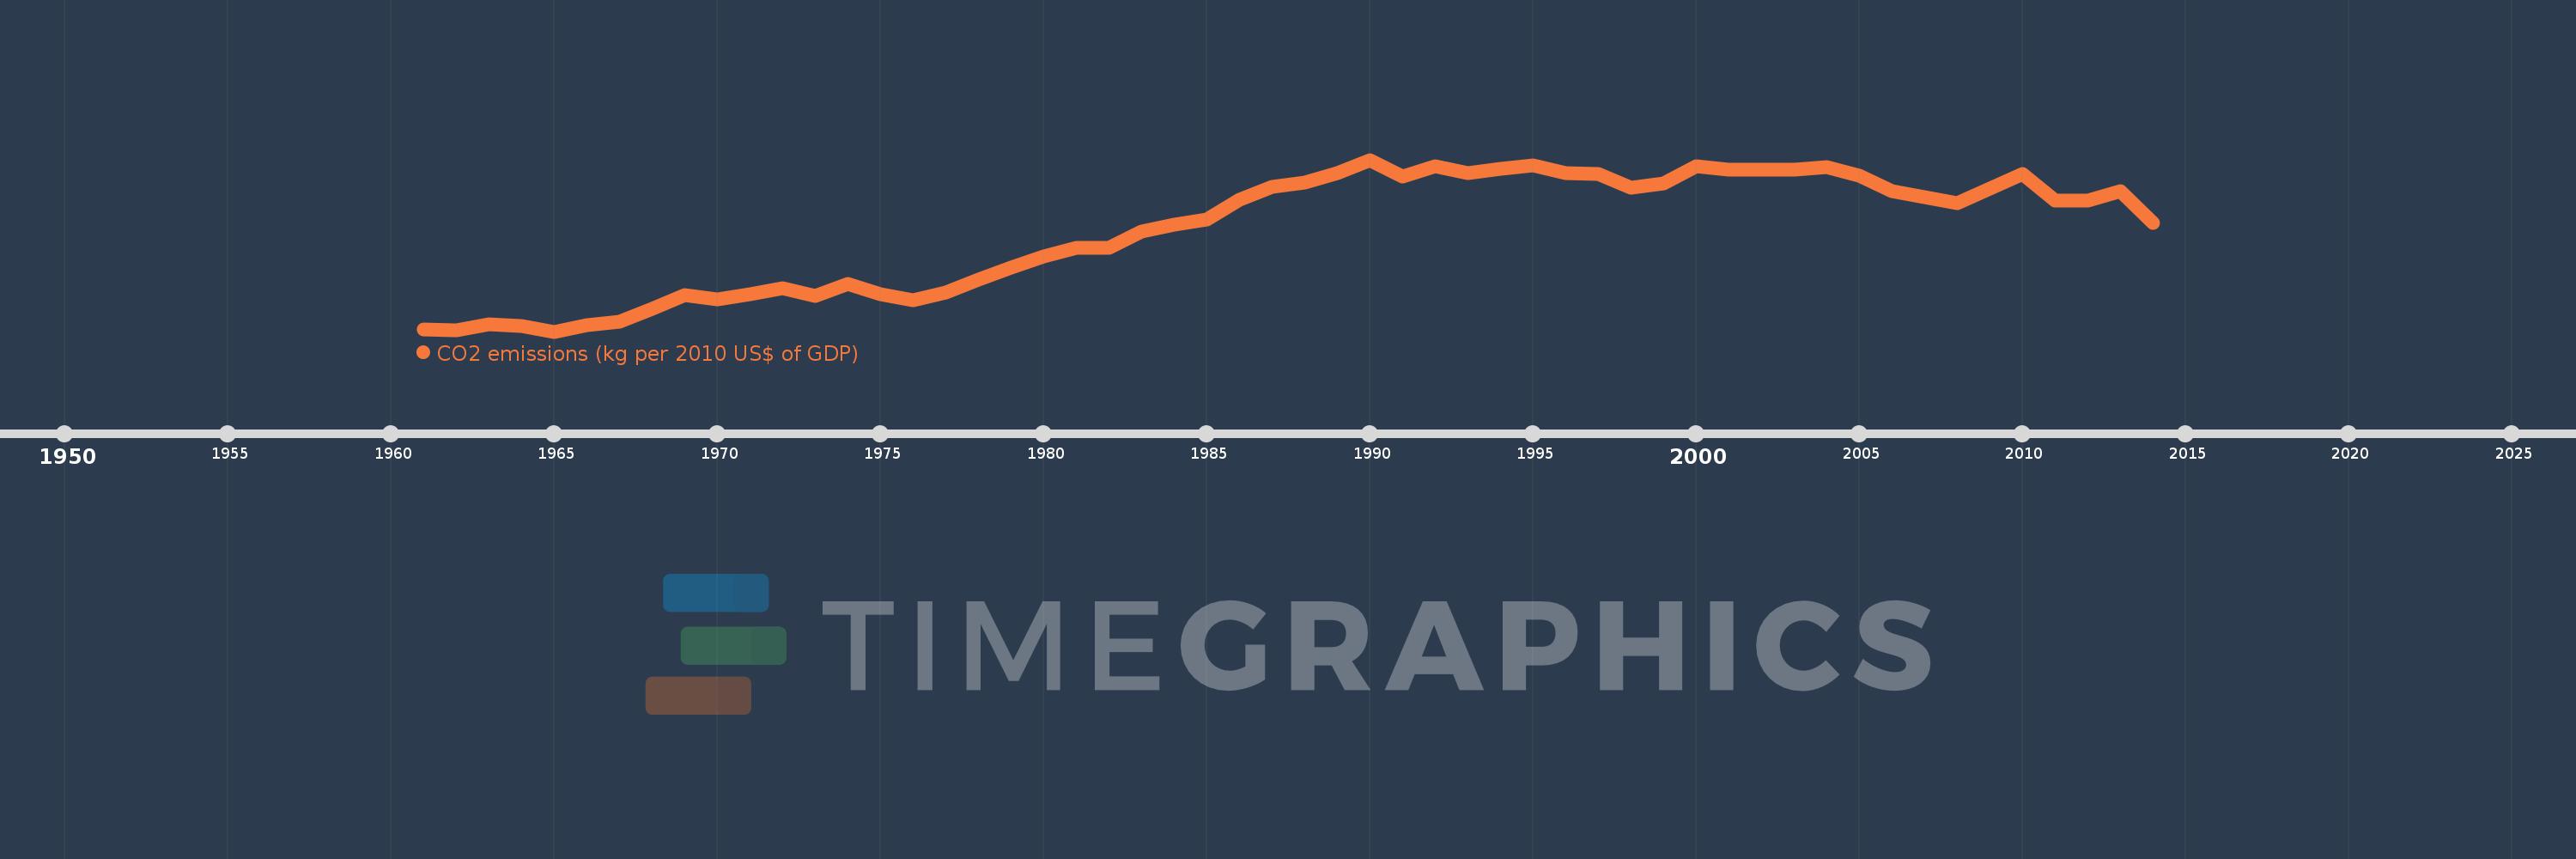
CO2 emissions (kg per 2010 US$ of GDP)
2014,2013,2012,2011,2010,2009,2008,2007,2006,2005,2004,2003,2002,2001,2000,1999,1998,1997,1996,1995,1994,1993,1992,1991,1990,1989,1988,1987,1986,1985,1984,1983,1982,1981,1980,1979,1978,1977,1976,1975,1974,1973,1972,1971,1970,1969,1968,1967,1966,1965,1964,1963,1962,1961
This statistics in other country:
AfghanistanAlbaniaAlgeriaAndorraAngolaAntigua and BarbudaArab WorldArgentinaArmeniaArubaAustraliaAustriaAzerbaijanBahamas, TheBahrainBangladeshBarbadosBelarusBelgiumBelizeBeninBermudaBhutanBoliviaBosnia and HerzegovinaBotswanaBrazilBrunei DarussalamBulgariaBurkina FasoBurundiCabo VerdeCambodiaCameroonCanadaCaribbean small statesCentral African RepublicCentral Europe and the BalticsChadChileChinaColombiaComorosCongo, Dem. Rep.Congo, Rep.Costa RicaCote d'IvoireCroatiaCubaCyprusCzech RepublicDenmarkDjiboutiDominicaDominican RepublicEarly-demographic dividendEast Asia & PacificEast Asia & Pacific (excluding high income)East Asia & Pacific (IDA & IBRD countries)EcuadorEgypt, Arab Rep.El SalvadorEquatorial GuineaEritreaEstoniaEthiopiaEuro areaEurope & Central AsiaEurope & Central Asia (excluding high income)Europe & Central Asia (IDA & IBRD countries)European UnionFaroe IslandsFijiFinlandFragile and conflict affected situationsFranceGabonGambia, TheGeorgiaGermanyGhanaGreeceGreenlandGrenadaGuatemalaGuineaGuinea-BissauGuyanaHaitiHeavily indebted poor countries (HIPC)High incomeHondurasHong Kong SAR, ChinaHungaryIBRD onlyIcelandIDA & IBRD totalIDA blendIDA onlyIDA totalIndiaIndonesiaIran, Islamic Rep.IraqIrelandIsraelItalyJamaicaJapanJordanKazakhstanKenyaKiribatiKorea, Rep.KuwaitKyrgyz RepublicLao PDRLate-demographic dividendLatin America & Caribbean Latin America & Caribbean (excluding high income)Latin America & the Caribbean (IDA & IBRD countries)LatviaLeast developed countries: UN classificationLebanonLesothoLiberiaLibyaLiechtensteinLithuaniaLow & middle incomeLow incomeLower middle incomeLuxembourgMacao SAR, ChinaMacedonia, FYRMadagascarMalawiMalaysiaMaldivesMaliMaltaMarshall IslandsMauritaniaMauritiusMexicoMicronesia, Fed. Sts.Middle East & North AfricaMiddle East & North Africa (excluding high income)Middle East & North Africa (IDA & IBRD countries)Middle incomeMoldovaMongoliaMontenegroMoroccoMozambiqueMyanmarNamibiaNauruNepalNetherlandsNew ZealandNicaraguaNigerNigeriaNorth AmericaNorwayOECD membersOmanOther small statesPacific island small statesPakistanPalauPanamaPapua New GuineaParaguayPeruPhilippinesPolandPortugalPost-demographic dividendPre-demographic dividendQatarRomaniaRussian FederationRwandaSamoaSao Tome and PrincipeSaudi ArabiaSenegalSerbiaSeychellesSierra LeoneSingaporeSlovak RepublicSloveniaSmall statesSolomon IslandsSouth AfricaSouth AsiaSouth Asia (IDA & IBRD)South SudanSpainSri LankaSt. Kitts and NevisSt. LuciaSt. Vincent and the GrenadinesSub-Saharan Africa Sub-Saharan Africa (excluding high income)Sub-Saharan Africa (IDA & IBRD countries)SudanSurinameSwazilandSwedenSwitzerlandTajikistanTanzaniaThailandTimor-LesteTogoTongaTrinidad and TobagoTunisiaTurkeyTurkmenistanUgandaUkraineUnited Arab EmiratesUnited KingdomUnited StatesUpper middle incomeUruguayUzbekistanVanuatuVenezuela, RBVietnamWest Bank and GazaWorldYemen, Rep.ZambiaZimbabwe Timeline:
This timeline shows a graph from 1961 to 2014 of Early-demographic dividend. No data until 1960. Number of actual observations by date: 54.
Source name:
World Development Indicators
Source organization:
Carbon Dioxide Information Analysis Center, Environmental Sciences Division, Oak Ridge National Laboratory, Tennessee, United States.
Categories, topics:
Climate Change, Environment
Last updated:
apr 23, 2017
Indicators value changes by year
At the date of observation
Value
Absolute change
Change from previous value
jan 1, 1961
0.544
+0.544
0.0%
jan 1, 1962
0.543
-0.001
-0.09%
jan 1, 1963
0.552
+0.008
1.56%
jan 1, 1964
0.549
-0.003
-0.46%
jan 1, 1965
0.541
-0.008
-1.47%
jan 1, 1966
0.55
+0.008
1.54%
jan 1, 1967
0.556
+0.006
1.15%
jan 1, 1968
0.574
+0.018
3.17%
jan 1, 1969
0.594
+0.02
3.56%
jan 1, 1970
0.588
-0.005
-0.92%
jan 1, 1971
0.595
+0.007
1.15%
jan 1, 1972
0.604
+0.008
1.41%
jan 1, 1973
0.593
-0.01
-1.69%
jan 1, 1974
0.611
+0.018
3.05%
jan 1, 1975
0.596
-0.015
-2.49%
jan 1, 1976
0.587
-0.009
-1.55%
jan 1, 1977
0.598
+0.011
1.89%
jan 1, 1978
0.617
+0.018
3.08%
jan 1, 1979
0.635
+0.018
2.96%
jan 1, 1980
0.651
+0.016
2.51%
jan 1, 1981
0.663
+0.012
1.92%
jan 1, 1982
0.663
0.0
-0.07%
jan 1, 1983
0.687
+0.024
3.61%
jan 1, 1984
0.697
+0.01
1.46%
jan 1, 1985
0.705
+0.008
1.14%
jan 1, 1986
0.734
+0.029
4.1%
jan 1, 1987
0.753
+0.02
2.68%
jan 1, 1988
0.759
+0.006
0.83%
jan 1, 1989
0.772
+0.012
1.62%
jan 1, 1990
0.792
+0.021
2.68%
jan 1, 1991
0.768
-0.024
-3.07%
jan 1, 1992
0.782
+0.013
1.75%
jan 1, 1993
0.772
-0.009
-1.21%
jan 1, 1994
0.779
+0.007
0.88%
jan 1, 1995
0.784
+0.005
0.67%
jan 1, 1996
0.772
-0.012
-1.53%
jan 1, 1997
0.771
-0.001
-0.17%
jan 1, 1998
0.751
-0.02
-2.61%
jan 1, 1999
0.758
+0.007
0.96%
jan 1, 2000
0.783
+0.025
3.3%
jan 1, 2001
0.777
-0.006
-0.73%
jan 1, 2002
0.778
+0.001
0.08%
jan 1, 2003
0.777
-0.001
-0.08%
jan 1, 2004
0.781
+0.004
0.5%
jan 1, 2005
0.769
-0.012
-1.57%
jan 1, 2006
0.746
-0.023
-2.93%
jan 1, 2007
0.738
-0.008
-1.09%
jan 1, 2008
0.729
-0.01
-1.31%
jan 1, 2009
0.75
+0.022
2.99%
jan 1, 2010
0.771
+0.02
2.71%
jan 1, 2011
0.732
-0.039
-5.03%
jan 1, 2012
0.732
0.0
-0.04%
jan 1, 2013
0.746
+0.014
1.95%
jan 1, 2014
0.7
-0.046
-6.2%
Ranking of countries by current statistics by years


Comments: