29
/
en
AIzaSyAYiBZKx7MnpbEhh9jyipgxe19OcubqV5w
April 1, 2024
162304
Jamaica
JAM
true
2
1
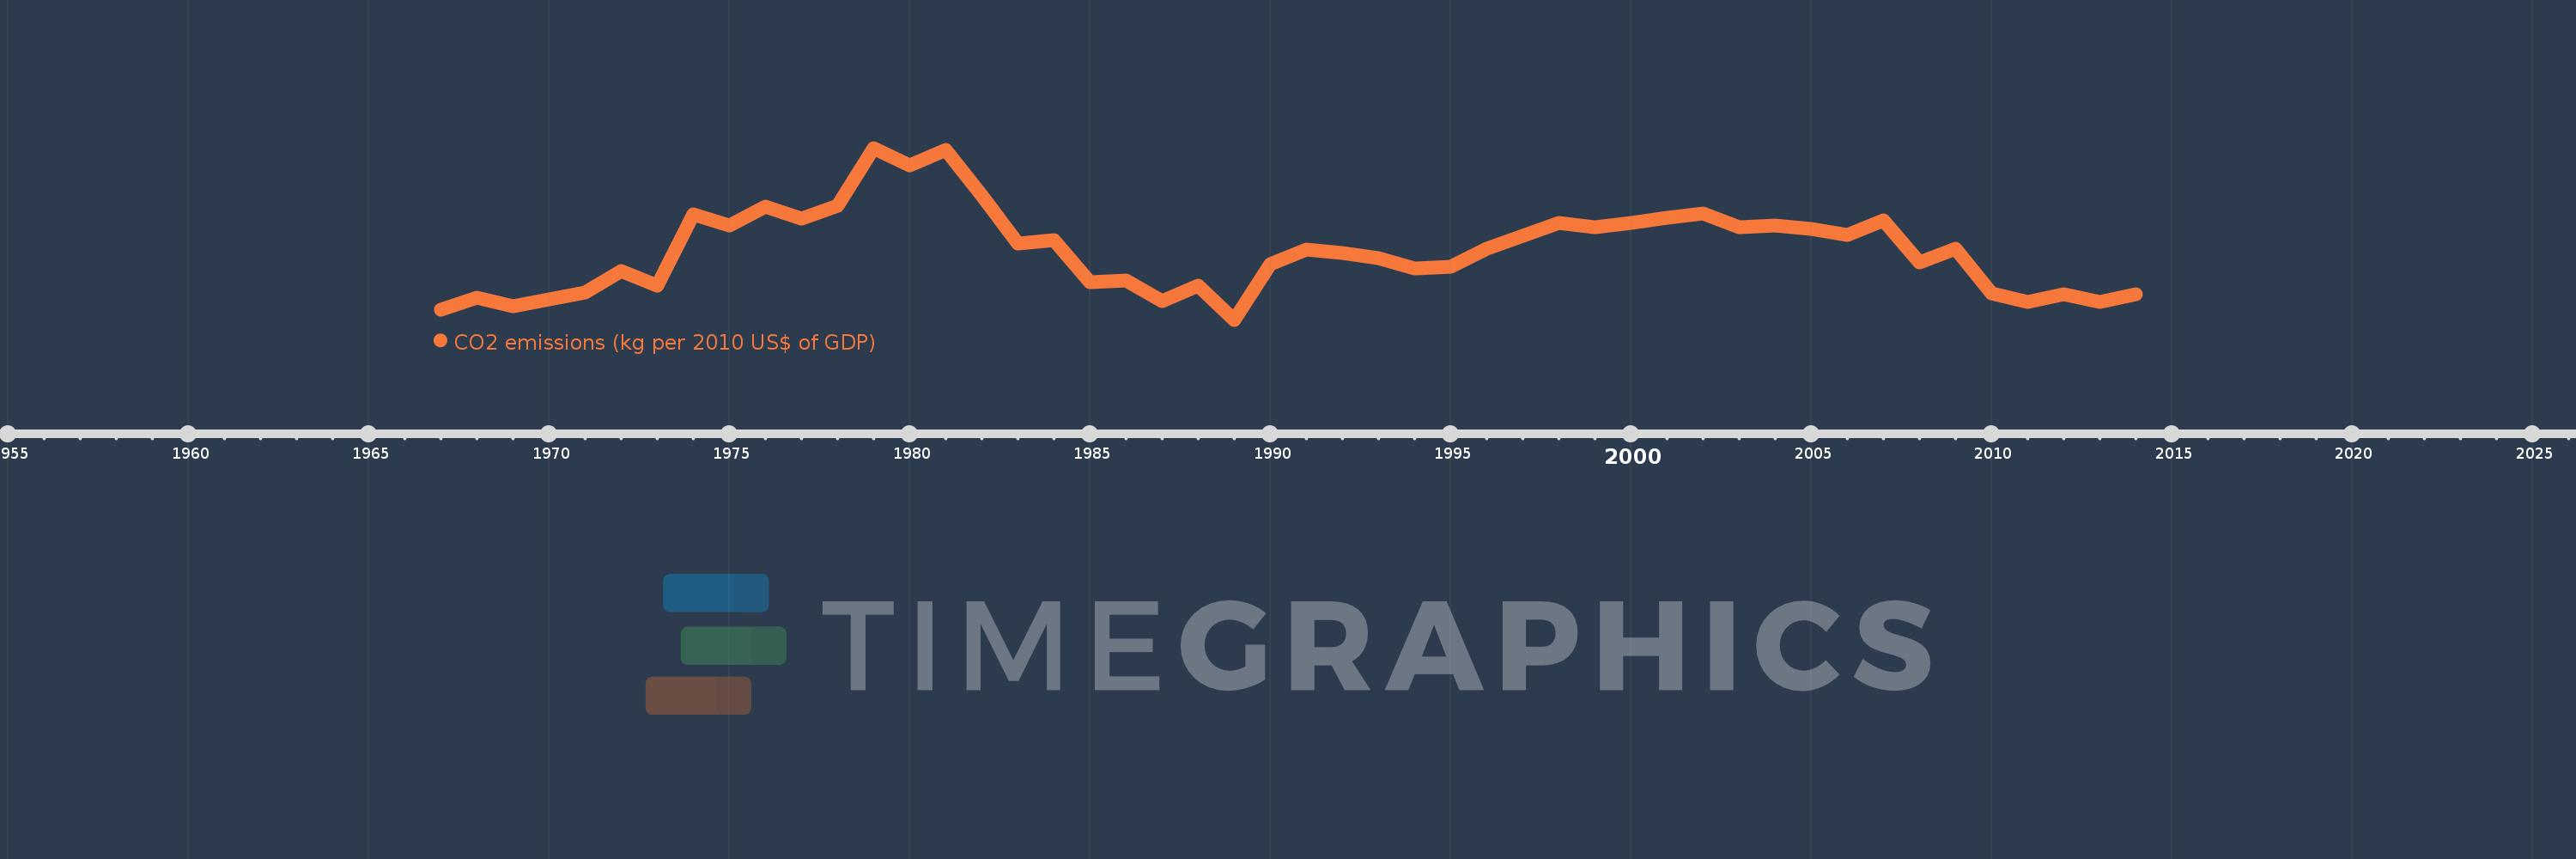
CO2 emissions (kg per 2010 US$ of GDP)
2014,2013,2012,2011,2010,2009,2008,2007,2006,2005,2004,2003,2002,2001,2000,1999,1998,1997,1996,1995,1994,1993,1992,1991,1990,1989,1988,1987,1986,1985,1984,1983,1982,1981,1980,1979,1978,1977,1976,1975,1974,1973,1972,1971,1970,1969,1968,1967
This statistics in other country:
AfghanistanAlbaniaAlgeriaAndorraAngolaAntigua and BarbudaArab WorldArgentinaArmeniaArubaAustraliaAustriaAzerbaijanBahamas, TheBahrainBangladeshBarbadosBelarusBelgiumBelizeBeninBermudaBhutanBoliviaBosnia and HerzegovinaBotswanaBrazilBrunei DarussalamBulgariaBurkina FasoBurundiCabo VerdeCambodiaCameroonCanadaCaribbean small statesCentral African RepublicCentral Europe and the BalticsChadChileChinaColombiaComorosCongo, Dem. Rep.Congo, Rep.Costa RicaCote d'IvoireCroatiaCubaCyprusCzech RepublicDenmarkDjiboutiDominicaDominican RepublicEarly-demographic dividendEast Asia & PacificEast Asia & Pacific (excluding high income)East Asia & Pacific (IDA & IBRD countries)EcuadorEgypt, Arab Rep.El SalvadorEquatorial GuineaEritreaEstoniaEthiopiaEuro areaEurope & Central AsiaEurope & Central Asia (excluding high income)Europe & Central Asia (IDA & IBRD countries)European UnionFaroe IslandsFijiFinlandFragile and conflict affected situationsFranceGabonGambia, TheGeorgiaGermanyGhanaGreeceGreenlandGrenadaGuatemalaGuineaGuinea-BissauGuyanaHaitiHeavily indebted poor countries (HIPC)High incomeHondurasHong Kong SAR, ChinaHungaryIBRD onlyIcelandIDA & IBRD totalIDA blendIDA onlyIDA totalIndiaIndonesiaIran, Islamic Rep.IraqIrelandIsraelItalyJamaicaJapanJordanKazakhstanKenyaKiribatiKorea, Rep.KuwaitKyrgyz RepublicLao PDRLate-demographic dividendLatin America & Caribbean Latin America & Caribbean (excluding high income)Latin America & the Caribbean (IDA & IBRD countries)LatviaLeast developed countries: UN classificationLebanonLesothoLiberiaLibyaLiechtensteinLithuaniaLow & middle incomeLow incomeLower middle incomeLuxembourgMacao SAR, ChinaMacedonia, FYRMadagascarMalawiMalaysiaMaldivesMaliMaltaMarshall IslandsMauritaniaMauritiusMexicoMicronesia, Fed. Sts.Middle East & North AfricaMiddle East & North Africa (excluding high income)Middle East & North Africa (IDA & IBRD countries)Middle incomeMoldovaMongoliaMontenegroMoroccoMozambiqueMyanmarNamibiaNauruNepalNetherlandsNew ZealandNicaraguaNigerNigeriaNorth AmericaNorwayOECD membersOmanOther small statesPacific island small statesPakistanPalauPanamaPapua New GuineaParaguayPeruPhilippinesPolandPortugalPost-demographic dividendPre-demographic dividendQatarRomaniaRussian FederationRwandaSamoaSao Tome and PrincipeSaudi ArabiaSenegalSerbiaSeychellesSierra LeoneSingaporeSlovak RepublicSloveniaSmall statesSolomon IslandsSouth AfricaSouth AsiaSouth Asia (IDA & IBRD)South SudanSpainSri LankaSt. Kitts and NevisSt. LuciaSt. Vincent and the GrenadinesSub-Saharan Africa Sub-Saharan Africa (excluding high income)Sub-Saharan Africa (IDA & IBRD countries)SudanSurinameSwazilandSwedenSwitzerlandTajikistanTanzaniaThailandTimor-LesteTogoTongaTrinidad and TobagoTunisiaTurkeyTurkmenistanUgandaUkraineUnited Arab EmiratesUnited KingdomUnited StatesUpper middle incomeUruguayUzbekistanVanuatuVenezuela, RBVietnamWest Bank and GazaWorldYemen, Rep.ZambiaZimbabwe Timeline:
This timeline shows a graph from 1967 to 2014 of Jamaica. No data until 1966. Number of actual observations by date: 48.
Source name:
World Development Indicators
Source organization:
Carbon Dioxide Information Analysis Center, Environmental Sciences Division, Oak Ridge National Laboratory, Tennessee, United States.
Categories, topics:
Climate Change, Environment
Last updated:
apr 23, 2017
Indicators value changes by year
At the date of observation
Value
Absolute change
Change from previous value
jan 1, 1967
0.522
+0.522
0.0%
jan 1, 1968
0.563
+0.041
7.94%
jan 1, 1969
0.535
-0.029
-5.07%
jan 1, 1970
0.557
+0.022
4.2%
jan 1, 1971
0.581
+0.024
4.32%
jan 1, 1972
0.654
+0.072
12.43%
jan 1, 1973
0.605
-0.048
-7.38%
jan 1, 1974
0.845
+0.24
39.61%
jan 1, 1975
0.809
-0.037
-4.35%
jan 1, 1976
0.873
+0.065
7.99%
jan 1, 1977
0.832
-0.041
-4.68%
jan 1, 1978
0.874
+0.042
4.99%
jan 1, 1979
1.071
+0.197
22.52%
jan 1, 1980
1.013
-0.058
-5.39%
jan 1, 1981
1.064
+0.051
5.01%
jan 1, 1982
0.909
-0.155
-14.53%
jan 1, 1983
0.747
-0.162
-17.82%
jan 1, 1984
0.76
+0.013
1.77%
jan 1, 1985
0.616
-0.144
-18.99%
jan 1, 1986
0.622
+0.006
1.05%
jan 1, 1987
0.551
-0.071
-11.48%
jan 1, 1988
0.604
+0.053
9.68%
jan 1, 1989
0.489
-0.115
-19.09%
jan 1, 1990
0.678
+0.189
38.64%
jan 1, 1991
0.728
+0.05
7.42%
jan 1, 1992
0.715
-0.013
-1.78%
jan 1, 1993
0.698
-0.017
-2.43%
jan 1, 1994
0.662
-0.036
-5.18%
jan 1, 1995
0.668
+0.007
0.99%
jan 1, 1996
0.731
+0.063
9.42%
jan 1, 1997
0.774
+0.043
5.83%
jan 1, 1998
0.817
+0.044
5.63%
jan 1, 1999
0.803
-0.015
-1.8%
jan 1, 2000
0.816
+0.013
1.61%
jan 1, 2001
0.835
+0.02
2.41%
jan 1, 2002
0.849
+0.014
1.62%
jan 1, 2003
0.803
-0.046
-5.41%
jan 1, 2004
0.807
+0.004
0.47%
jan 1, 2005
0.796
-0.01
-1.27%
jan 1, 2006
0.777
-0.02
-2.49%
jan 1, 2007
0.826
+0.05
6.42%
jan 1, 2008
0.684
-0.142
-17.23%
jan 1, 2009
0.729
+0.045
6.64%
jan 1, 2010
0.578
-0.151
-20.74%
jan 1, 2011
0.55
-0.028
-4.86%
jan 1, 2012
0.575
+0.025
4.61%
jan 1, 2013
0.549
-0.026
-4.53%
jan 1, 2014
0.576
+0.027
4.93%
Ranking of countries by current statistics by years


Comments: