29
/
en
AIzaSyAYiBZKx7MnpbEhh9jyipgxe19OcubqV5w
April 1, 2024
252792
Sudan
SDN
true
2
1
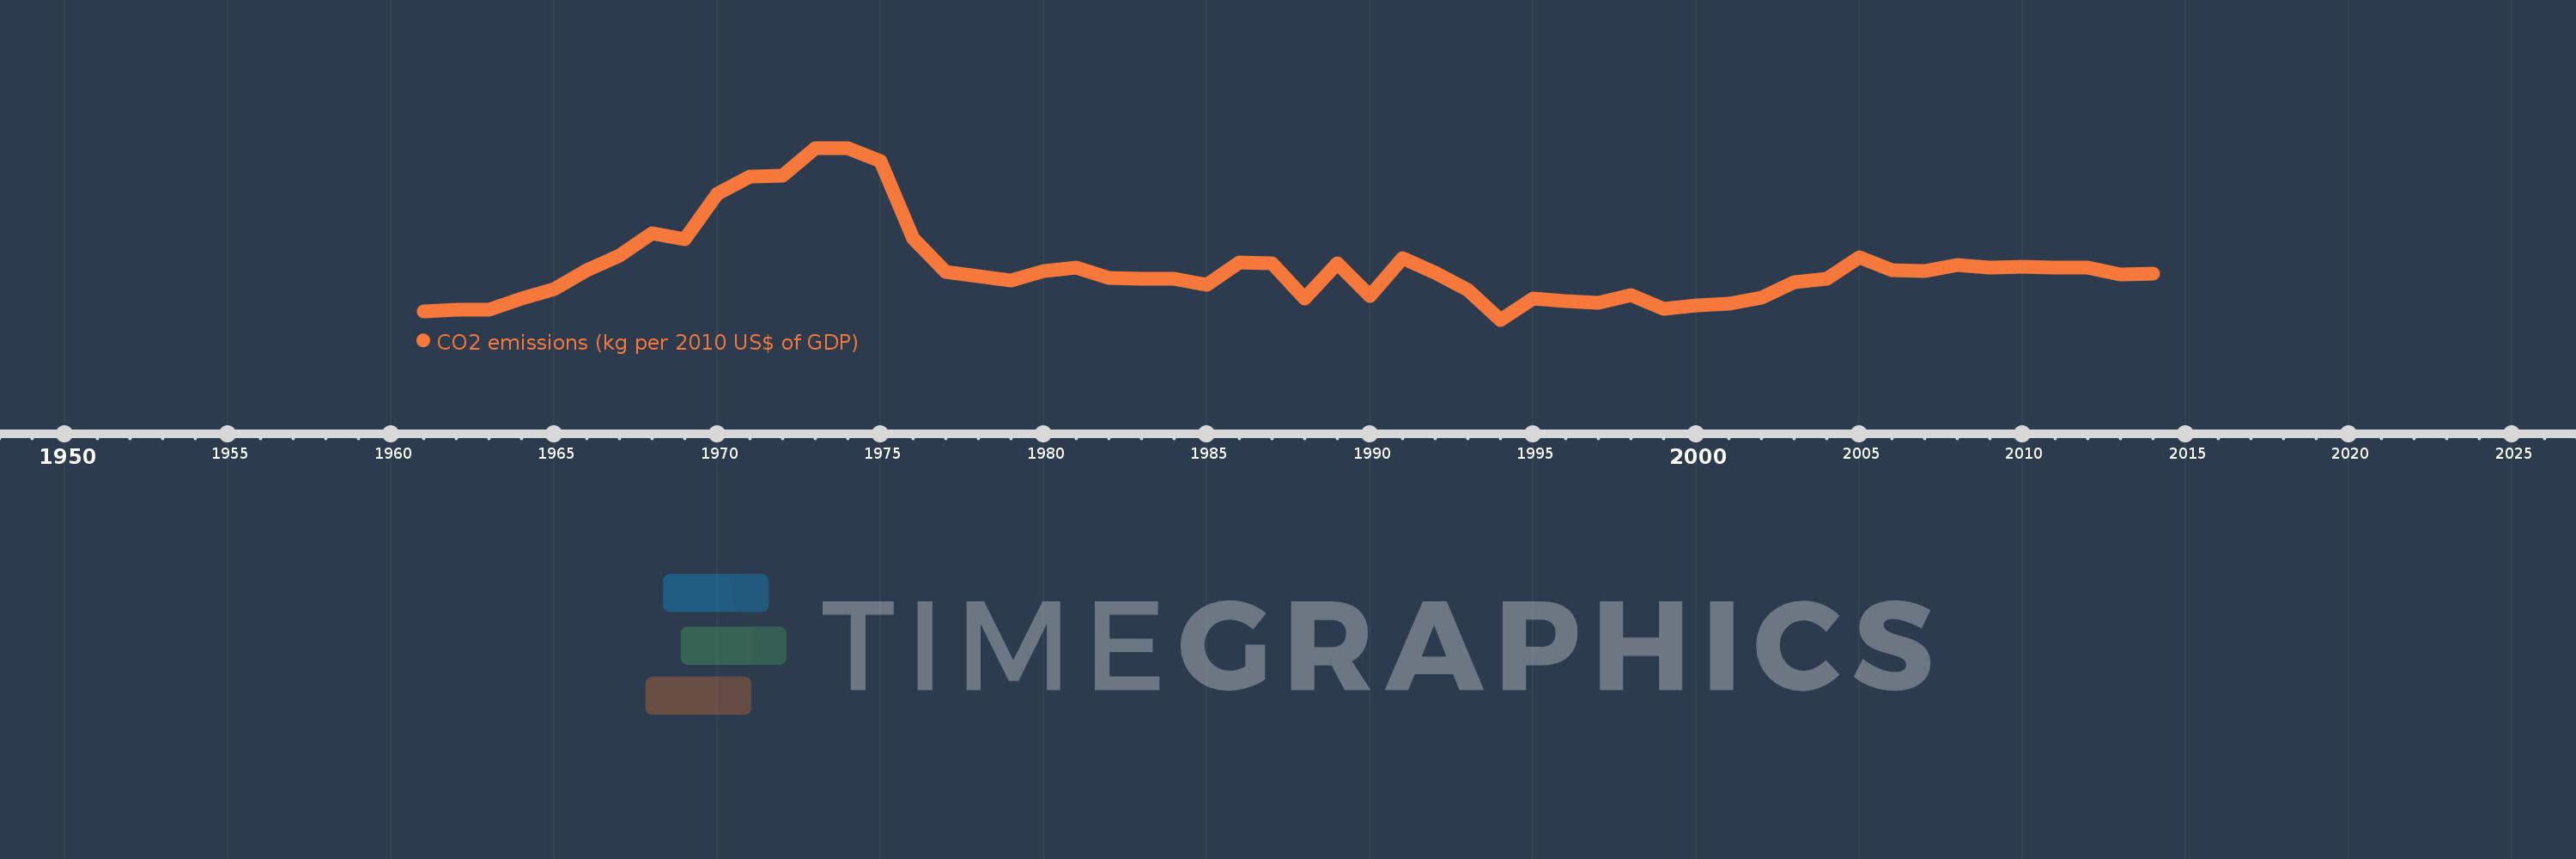
CO2 emissions (kg per 2010 US$ of GDP)
2014,2013,2012,2011,2010,2009,2008,2007,2006,2005,2004,2003,2002,2001,2000,1999,1998,1997,1996,1995,1994,1993,1992,1991,1990,1989,1988,1987,1986,1985,1984,1983,1982,1981,1980,1979,1978,1977,1976,1975,1974,1973,1972,1971,1970,1969,1968,1967,1966,1965,1964,1963,1962,1961
This statistics in other country:
AfghanistanAlbaniaAlgeriaAndorraAngolaAntigua and BarbudaArab WorldArgentinaArmeniaArubaAustraliaAustriaAzerbaijanBahamas, TheBahrainBangladeshBarbadosBelarusBelgiumBelizeBeninBermudaBhutanBoliviaBosnia and HerzegovinaBotswanaBrazilBrunei DarussalamBulgariaBurkina FasoBurundiCabo VerdeCambodiaCameroonCanadaCaribbean small statesCentral African RepublicCentral Europe and the BalticsChadChileChinaColombiaComorosCongo, Dem. Rep.Congo, Rep.Costa RicaCote d'IvoireCroatiaCubaCyprusCzech RepublicDenmarkDjiboutiDominicaDominican RepublicEarly-demographic dividendEast Asia & PacificEast Asia & Pacific (excluding high income)East Asia & Pacific (IDA & IBRD countries)EcuadorEgypt, Arab Rep.El SalvadorEquatorial GuineaEritreaEstoniaEthiopiaEuro areaEurope & Central AsiaEurope & Central Asia (excluding high income)Europe & Central Asia (IDA & IBRD countries)European UnionFaroe IslandsFijiFinlandFragile and conflict affected situationsFranceGabonGambia, TheGeorgiaGermanyGhanaGreeceGreenlandGrenadaGuatemalaGuineaGuinea-BissauGuyanaHaitiHeavily indebted poor countries (HIPC)High incomeHondurasHong Kong SAR, ChinaHungaryIBRD onlyIcelandIDA & IBRD totalIDA blendIDA onlyIDA totalIndiaIndonesiaIran, Islamic Rep.IraqIrelandIsraelItalyJamaicaJapanJordanKazakhstanKenyaKiribatiKorea, Rep.KuwaitKyrgyz RepublicLao PDRLate-demographic dividendLatin America & Caribbean Latin America & Caribbean (excluding high income)Latin America & the Caribbean (IDA & IBRD countries)LatviaLeast developed countries: UN classificationLebanonLesothoLiberiaLibyaLiechtensteinLithuaniaLow & middle incomeLow incomeLower middle incomeLuxembourgMacao SAR, ChinaMacedonia, FYRMadagascarMalawiMalaysiaMaldivesMaliMaltaMarshall IslandsMauritaniaMauritiusMexicoMicronesia, Fed. Sts.Middle East & North AfricaMiddle East & North Africa (excluding high income)Middle East & North Africa (IDA & IBRD countries)Middle incomeMoldovaMongoliaMontenegroMoroccoMozambiqueMyanmarNamibiaNauruNepalNetherlandsNew ZealandNicaraguaNigerNigeriaNorth AmericaNorwayOECD membersOmanOther small statesPacific island small statesPakistanPalauPanamaPapua New GuineaParaguayPeruPhilippinesPolandPortugalPost-demographic dividendPre-demographic dividendQatarRomaniaRussian FederationRwandaSamoaSao Tome and PrincipeSaudi ArabiaSenegalSerbiaSeychellesSierra LeoneSingaporeSlovak RepublicSloveniaSmall statesSolomon IslandsSouth AfricaSouth AsiaSouth Asia (IDA & IBRD)South SudanSpainSri LankaSt. Kitts and NevisSt. LuciaSt. Vincent and the GrenadinesSub-Saharan Africa Sub-Saharan Africa (excluding high income)Sub-Saharan Africa (IDA & IBRD countries)SudanSurinameSwazilandSwedenSwitzerlandTajikistanTanzaniaThailandTimor-LesteTogoTongaTrinidad and TobagoTunisiaTurkeyTurkmenistanUgandaUkraineUnited Arab EmiratesUnited KingdomUnited StatesUpper middle incomeUruguayUzbekistanVanuatuVenezuela, RBVietnamWest Bank and GazaWorldYemen, Rep.ZambiaZimbabwe Timeline:
This timeline shows a graph from 1961 to 2014 of Sudan. No data until 1960. Number of actual observations by date: 54.
Source name:
World Development Indicators
Source organization:
Carbon Dioxide Information Analysis Center, Environmental Sciences Division, Oak Ridge National Laboratory, Tennessee, United States.
Categories, topics:
Climate Change, Environment
Last updated:
apr 23, 2017
Indicators value changes by year
At the date of observation
Value
Absolute change
Change from previous value
jan 1, 1961
0.146
+0.146
0.0%
jan 1, 1962
0.149
+0.003
1.86%
jan 1, 1963
0.149
+0.0
0.21%
jan 1, 1964
0.173
+0.024
16.4%
jan 1, 1965
0.194
+0.021
11.95%
jan 1, 1966
0.237
+0.043
22.28%
jan 1, 1967
0.268
+0.031
12.95%
jan 1, 1968
0.319
+0.051
18.83%
jan 1, 1969
0.305
-0.014
-4.41%
jan 1, 1970
0.405
+0.1
32.86%
jan 1, 1971
0.443
+0.039
9.55%
jan 1, 1972
0.445
+0.002
0.39%
jan 1, 1973
0.506
+0.061
13.71%
jan 1, 1974
0.507
+0.001
0.25%
jan 1, 1975
0.477
-0.031
-6.03%
jan 1, 1976
0.307
-0.169
-35.55%
jan 1, 1977
0.233
-0.074
-24.07%
jan 1, 1978
0.223
-0.011
-4.57%
jan 1, 1979
0.214
-0.009
-3.94%
jan 1, 1980
0.234
+0.02
9.32%
jan 1, 1981
0.242
+0.008
3.35%
jan 1, 1982
0.219
-0.023
-9.56%
jan 1, 1983
0.217
-0.002
-0.78%
jan 1, 1984
0.217
+0.0
0.04%
jan 1, 1985
0.205
-0.012
-5.59%
jan 1, 1986
0.254
+0.049
24.0%
jan 1, 1987
0.251
-0.003
-1.04%
jan 1, 1988
0.174
-0.078
-30.96%
jan 1, 1989
0.252
+0.078
45.12%
jan 1, 1990
0.179
-0.073
-28.82%
jan 1, 1991
0.263
+0.084
46.97%
jan 1, 1992
0.23
-0.034
-12.86%
jan 1, 1993
0.193
-0.037
-16.02%
jan 1, 1994
0.127
-0.066
-34.0%
jan 1, 1995
0.173
+0.046
35.89%
jan 1, 1996
0.169
-0.004
-2.24%
jan 1, 1997
0.165
-0.004
-2.61%
jan 1, 1998
0.182
+0.017
10.57%
jan 1, 1999
0.151
-0.031
-16.91%
jan 1, 2000
0.159
+0.008
5.17%
jan 1, 2001
0.162
+0.003
2.16%
jan 1, 2002
0.176
+0.013
8.08%
jan 1, 2003
0.21
+0.035
19.76%
jan 1, 2004
0.218
+0.008
3.72%
jan 1, 2005
0.265
+0.047
21.63%
jan 1, 2006
0.237
-0.029
-10.87%
jan 1, 2007
0.235
-0.001
-0.62%
jan 1, 2008
0.248
+0.013
5.43%
jan 1, 2009
0.243
-0.005
-2.06%
jan 1, 2010
0.245
+0.003
1.08%
jan 1, 2011
0.243
-0.002
-1.01%
jan 1, 2012
0.243
+0.0
0.2%
jan 1, 2013
0.227
-0.017
-6.86%
jan 1, 2014
0.229
+0.002
0.92%
Ranking of countries by current statistics by years


Comments: