29
/
en
AIzaSyAYiBZKx7MnpbEhh9jyipgxe19OcubqV5w
April 1, 2024
251689
St. Vincent and the Grenadines
VCT
true
2
1
CO2 emissions (kg per 2010 US$ of GDP)
2014,2013,2012,2011,2010,2009,2008,2007,2006,2005,2004,2003,2002,2001,2000,1999,1998,1997,1996,1995,1994,1993,1992,1991,1990,1989,1988,1987,1986,1985,1984,1983,1982,1981,1980,1979,1978,1977,1976,1975,1974,1973,1972,1971,1970,1969,1968,1967,1966,1965,1964,1963,1962,1961
This statistics in other country:
AfghanistanAlbaniaAlgeriaAndorraAngolaAntigua and BarbudaArab WorldArgentinaArmeniaArubaAustraliaAustriaAzerbaijanBahamas, TheBahrainBangladeshBarbadosBelarusBelgiumBelizeBeninBermudaBhutanBoliviaBosnia and HerzegovinaBotswanaBrazilBrunei DarussalamBulgariaBurkina FasoBurundiCabo VerdeCambodiaCameroonCanadaCaribbean small statesCentral African RepublicCentral Europe and the BalticsChadChileChinaColombiaComorosCongo, Dem. Rep.Congo, Rep.Costa RicaCote d'IvoireCroatiaCubaCyprusCzech RepublicDenmarkDjiboutiDominicaDominican RepublicEarly-demographic dividendEast Asia & PacificEast Asia & Pacific (excluding high income)East Asia & Pacific (IDA & IBRD countries)EcuadorEgypt, Arab Rep.El SalvadorEquatorial GuineaEritreaEstoniaEthiopiaEuro areaEurope & Central AsiaEurope & Central Asia (excluding high income)Europe & Central Asia (IDA & IBRD countries)European UnionFaroe IslandsFijiFinlandFragile and conflict affected situationsFranceGabonGambia, TheGeorgiaGermanyGhanaGreeceGreenlandGrenadaGuatemalaGuineaGuinea-BissauGuyanaHaitiHeavily indebted poor countries (HIPC)High incomeHondurasHong Kong SAR, ChinaHungaryIBRD onlyIcelandIDA & IBRD totalIDA blendIDA onlyIDA totalIndiaIndonesiaIran, Islamic Rep.IraqIrelandIsraelItalyJamaicaJapanJordanKazakhstanKenyaKiribatiKorea, Rep.KuwaitKyrgyz RepublicLao PDRLate-demographic dividendLatin America & Caribbean Latin America & Caribbean (excluding high income)Latin America & the Caribbean (IDA & IBRD countries)LatviaLeast developed countries: UN classificationLebanonLesothoLiberiaLibyaLiechtensteinLithuaniaLow & middle incomeLow incomeLower middle incomeLuxembourgMacao SAR, ChinaMacedonia, FYRMadagascarMalawiMalaysiaMaldivesMaliMaltaMarshall IslandsMauritaniaMauritiusMexicoMicronesia, Fed. Sts.Middle East & North AfricaMiddle East & North Africa (excluding high income)Middle East & North Africa (IDA & IBRD countries)Middle incomeMoldovaMongoliaMontenegroMoroccoMozambiqueMyanmarNamibiaNauruNepalNetherlandsNew ZealandNicaraguaNigerNigeriaNorth AmericaNorwayOECD membersOmanOther small statesPacific island small statesPakistanPalauPanamaPapua New GuineaParaguayPeruPhilippinesPolandPortugalPost-demographic dividendPre-demographic dividendQatarRomaniaRussian FederationRwandaSamoaSao Tome and PrincipeSaudi ArabiaSenegalSerbiaSeychellesSierra LeoneSingaporeSlovak RepublicSloveniaSmall statesSolomon IslandsSouth AfricaSouth AsiaSouth Asia (IDA & IBRD)South SudanSpainSri LankaSt. Kitts and NevisSt. LuciaSt. Vincent and the GrenadinesSub-Saharan Africa Sub-Saharan Africa (excluding high income)Sub-Saharan Africa (IDA & IBRD countries)SudanSurinameSwazilandSwedenSwitzerlandTajikistanTanzaniaThailandTimor-LesteTogoTongaTrinidad and TobagoTunisiaTurkeyTurkmenistanUgandaUkraineUnited Arab EmiratesUnited KingdomUnited StatesUpper middle incomeUruguayUzbekistanVanuatuVenezuela, RBVietnamWest Bank and GazaWorldYemen, Rep.ZambiaZimbabwe Timeline:
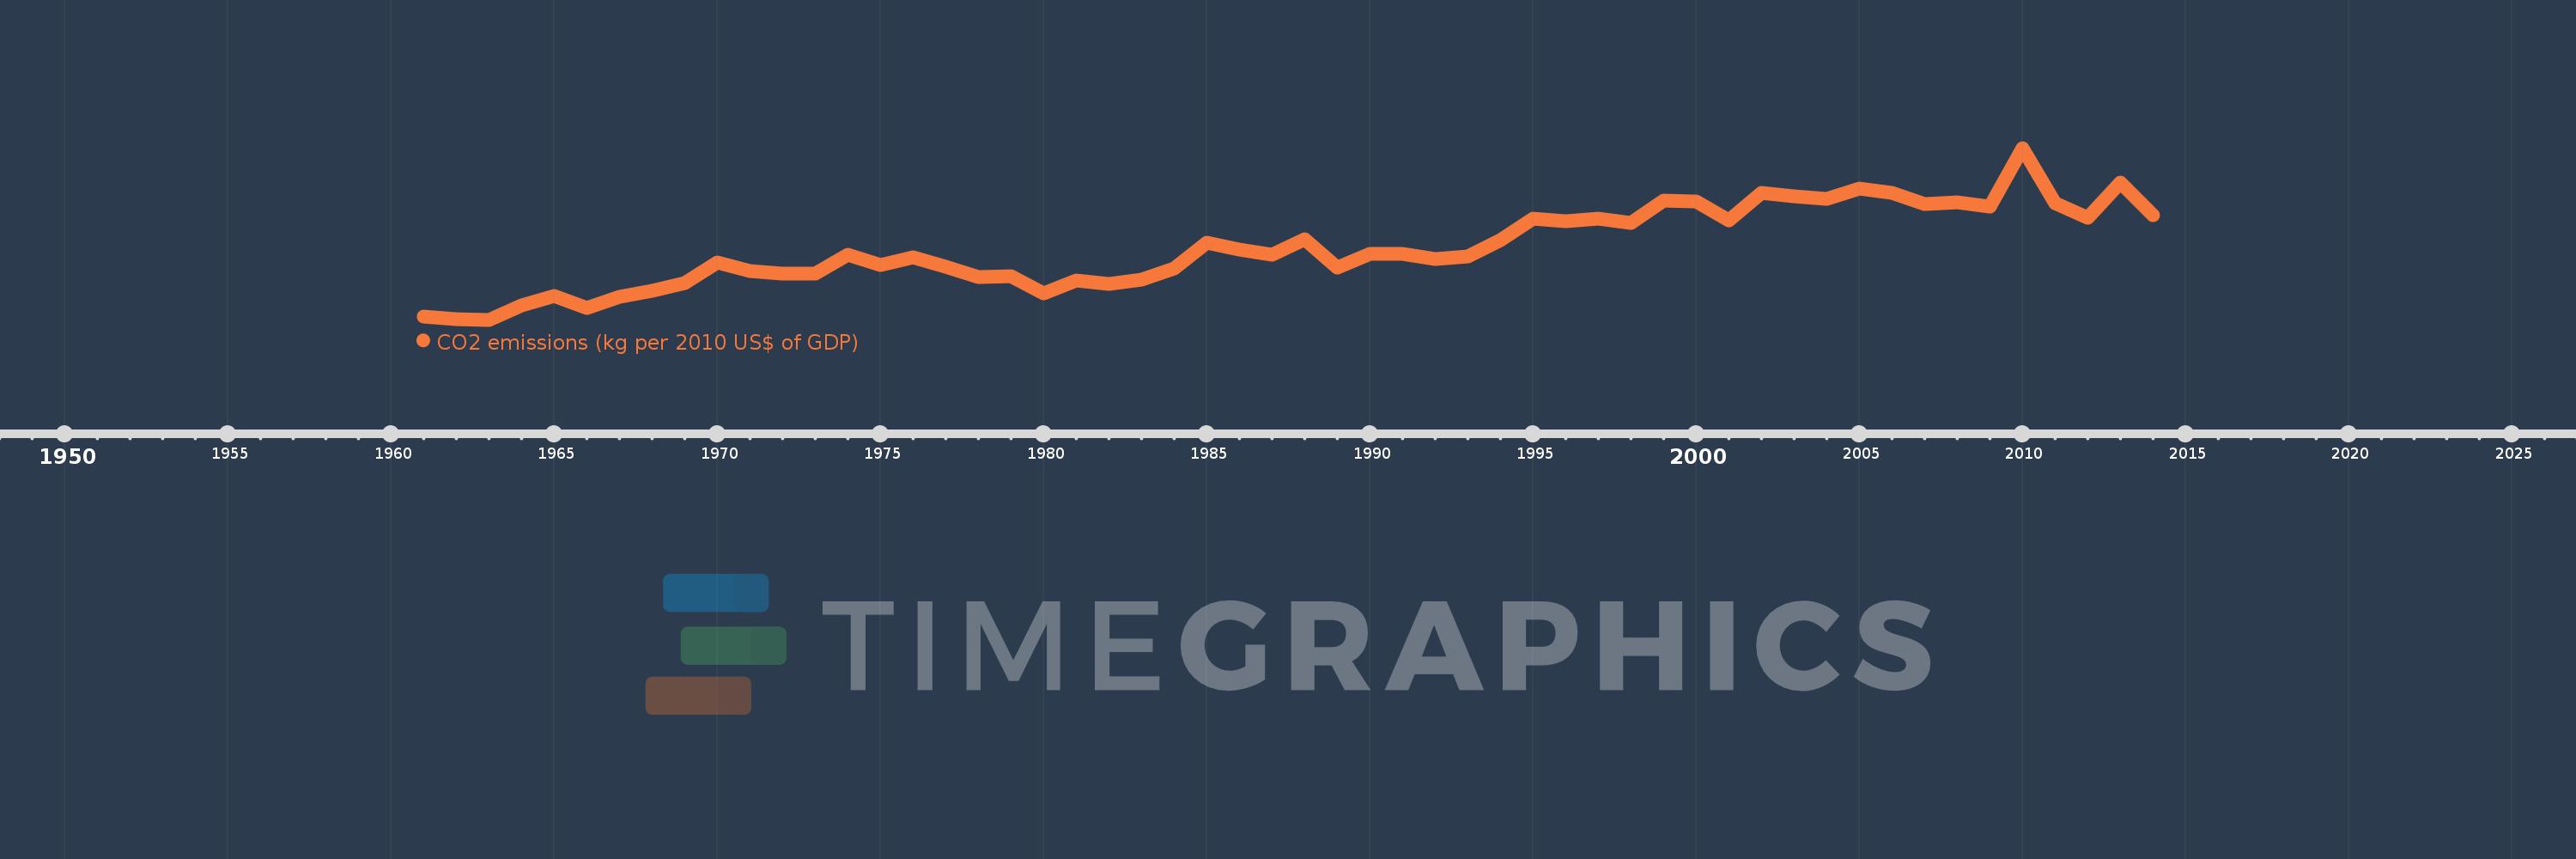
This timeline shows a graph from 1961 to 2014 of St. Vincent and the Grenadines. No data until 1960. Number of actual observations by date: 54.
Source name:
World Development Indicators
Source organization:
Carbon Dioxide Information Analysis Center, Environmental Sciences Division, Oak Ridge National Laboratory, Tennessee, United States.
Categories, topics:
Climate Change, Environment
Last updated:
apr 23, 2017
Indicators value changes by year
At the date of observation
Value
Absolute change
Change from previous value
jan 1, 1961
0.078
+0.078
0.0%
jan 1, 1962
0.074
-0.003
-4.33%
jan 1, 1963
0.072
-0.003
-3.56%
jan 1, 1964
0.102
+0.03
42.25%
jan 1, 1965
0.123
+0.021
20.58%
jan 1, 1966
0.097
-0.025
-20.7%
jan 1, 1967
0.122
+0.024
25.0%
jan 1, 1968
0.134
+0.013
10.53%
jan 1, 1969
0.151
+0.017
12.67%
jan 1, 1970
0.196
+0.045
29.62%
jan 1, 1971
0.177
-0.019
-9.7%
jan 1, 1972
0.172
-0.005
-2.88%
jan 1, 1973
0.171
-0.001
-0.66%
jan 1, 1974
0.212
+0.041
23.74%
jan 1, 1975
0.19
-0.022
-10.27%
jan 1, 1976
0.206
+0.016
8.24%
jan 1, 1977
0.186
-0.019
-9.4%
jan 1, 1978
0.164
-0.022
-11.68%
jan 1, 1979
0.166
+0.002
1.22%
jan 1, 1980
0.129
-0.038
-22.62%
jan 1, 1981
0.157
+0.028
22.02%
jan 1, 1982
0.15
-0.007
-4.41%
jan 1, 1983
0.158
+0.008
5.29%
jan 1, 1984
0.183
+0.025
15.67%
jan 1, 1985
0.238
+0.055
29.9%
jan 1, 1986
0.224
-0.014
-5.82%
jan 1, 1987
0.212
-0.012
-5.3%
jan 1, 1988
0.246
+0.034
16.16%
jan 1, 1989
0.185
-0.061
-24.86%
jan 1, 1990
0.213
+0.028
15.05%
jan 1, 1991
0.214
+0.001
0.59%
jan 1, 1992
0.202
-0.012
-5.62%
jan 1, 1993
0.208
+0.006
2.96%
jan 1, 1994
0.243
+0.035
16.77%
jan 1, 1995
0.29
+0.047
19.35%
jan 1, 1996
0.285
-0.005
-1.58%
jan 1, 1997
0.29
+0.004
1.55%
jan 1, 1998
0.28
-0.01
-3.39%
jan 1, 1999
0.329
+0.049
17.42%
jan 1, 2000
0.327
-0.001
-0.43%
jan 1, 2001
0.286
-0.041
-12.54%
jan 1, 2002
0.345
+0.059
20.44%
jan 1, 2003
0.338
-0.007
-2.11%
jan 1, 2004
0.332
-0.006
-1.68%
jan 1, 2005
0.354
+0.022
6.68%
jan 1, 2006
0.345
-0.009
-2.43%
jan 1, 2007
0.321
-0.025
-7.12%
jan 1, 2008
0.324
+0.003
0.87%
jan 1, 2009
0.316
-0.008
-2.44%
jan 1, 2010
0.442
+0.126
40.04%
jan 1, 2011
0.323
-0.119
-26.96%
jan 1, 2012
0.292
-0.031
-9.62%
jan 1, 2013
0.368
+0.076
26.04%
jan 1, 2014
0.298
-0.069
-18.88%
Ranking of countries by current statistics by years


Comments: