29
/
en
AIzaSyAYiBZKx7MnpbEhh9jyipgxe19OcubqV5w
April 1, 2024
47967
Middle East & North Africa
MEA
false
2
1
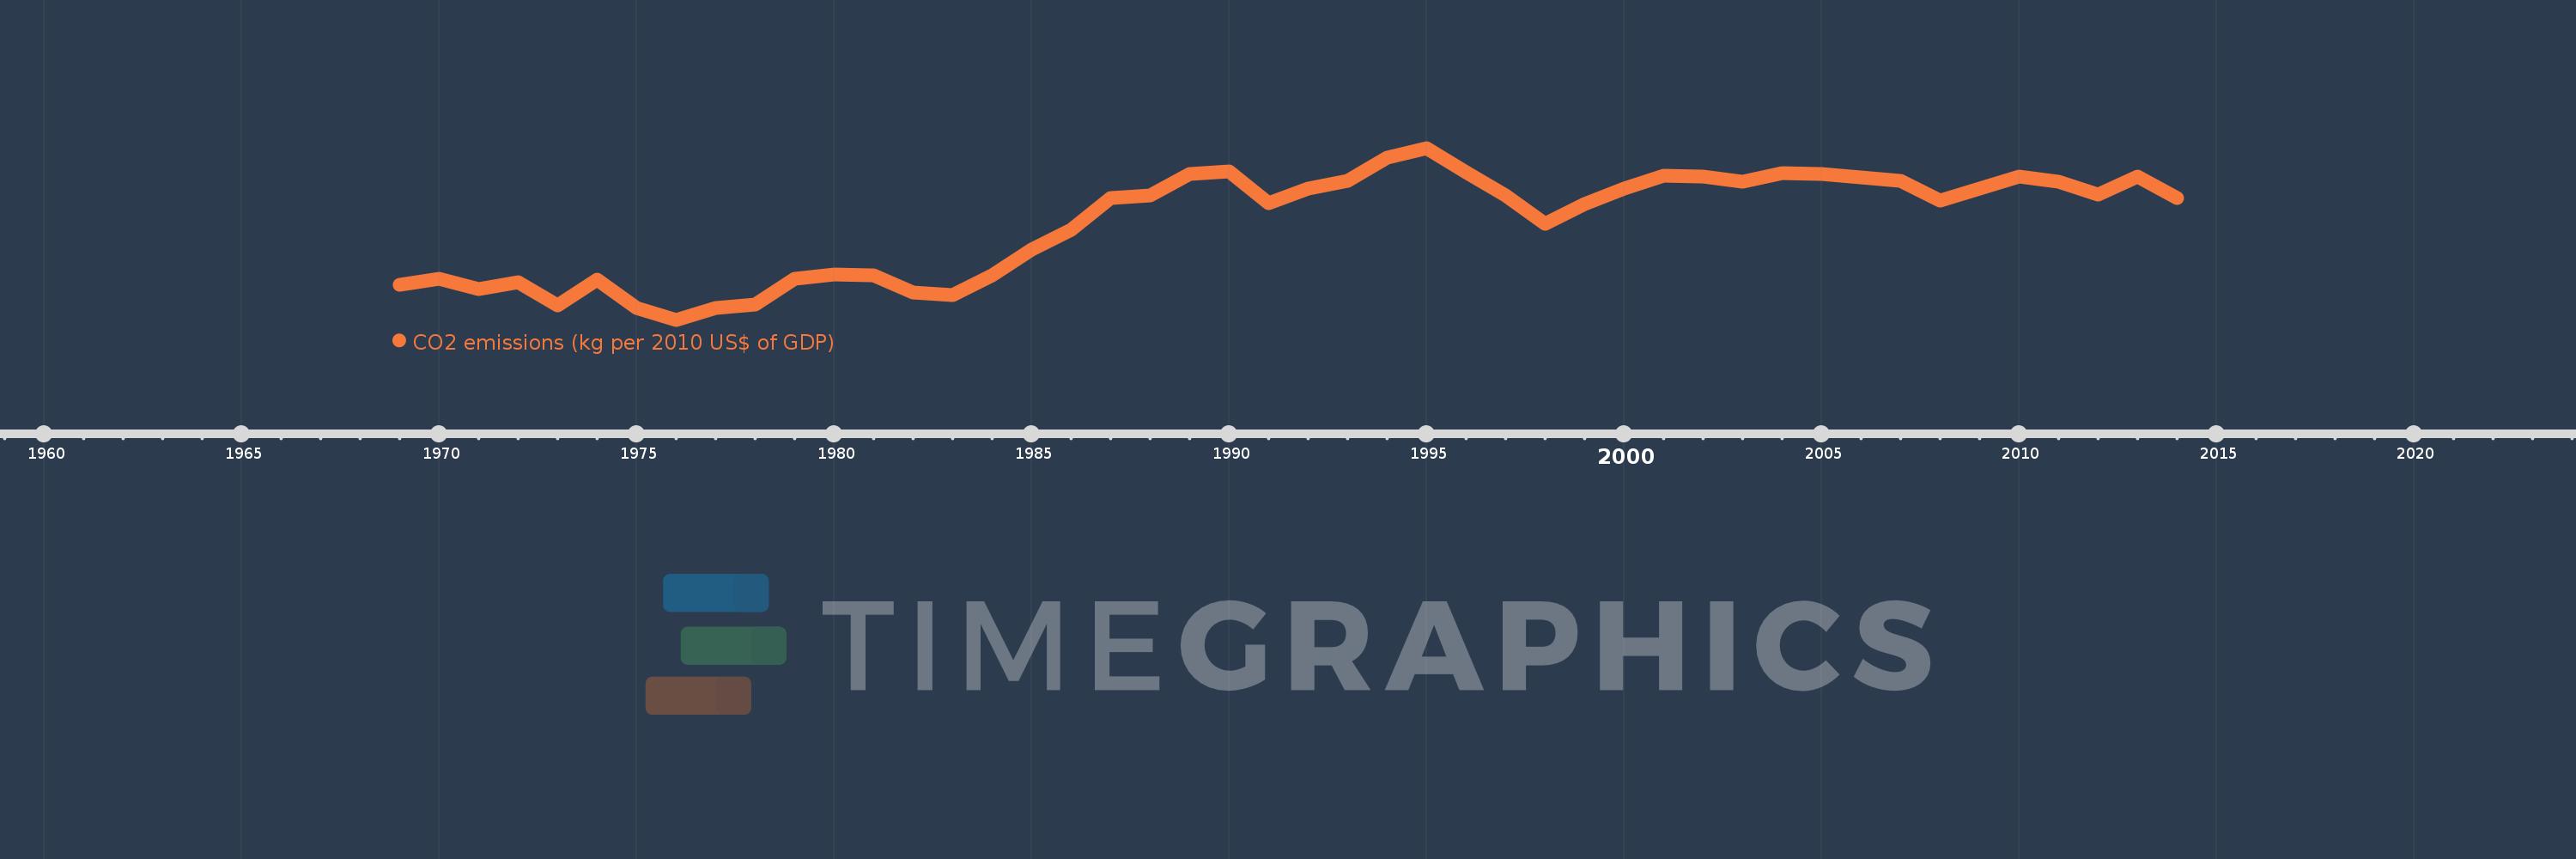
CO2 emissions (kg per 2010 US$ of GDP)
2014,2013,2012,2011,2010,2009,2008,2007,2006,2005,2004,2003,2002,2001,2000,1999,1998,1997,1996,1995,1994,1993,1992,1991,1990,1989,1988,1987,1986,1985,1984,1983,1982,1981,1980,1979,1978,1977,1976,1975,1974,1973,1972,1971,1970,1969
This statistics in other country:
AfghanistanAlbaniaAlgeriaAndorraAngolaAntigua and BarbudaArab WorldArgentinaArmeniaArubaAustraliaAustriaAzerbaijanBahamas, TheBahrainBangladeshBarbadosBelarusBelgiumBelizeBeninBermudaBhutanBoliviaBosnia and HerzegovinaBotswanaBrazilBrunei DarussalamBulgariaBurkina FasoBurundiCabo VerdeCambodiaCameroonCanadaCaribbean small statesCentral African RepublicCentral Europe and the BalticsChadChileChinaColombiaComorosCongo, Dem. Rep.Congo, Rep.Costa RicaCote d'IvoireCroatiaCubaCyprusCzech RepublicDenmarkDjiboutiDominicaDominican RepublicEarly-demographic dividendEast Asia & PacificEast Asia & Pacific (excluding high income)East Asia & Pacific (IDA & IBRD countries)EcuadorEgypt, Arab Rep.El SalvadorEquatorial GuineaEritreaEstoniaEthiopiaEuro areaEurope & Central AsiaEurope & Central Asia (excluding high income)Europe & Central Asia (IDA & IBRD countries)European UnionFaroe IslandsFijiFinlandFragile and conflict affected situationsFranceGabonGambia, TheGeorgiaGermanyGhanaGreeceGreenlandGrenadaGuatemalaGuineaGuinea-BissauGuyanaHaitiHeavily indebted poor countries (HIPC)High incomeHondurasHong Kong SAR, ChinaHungaryIBRD onlyIcelandIDA & IBRD totalIDA blendIDA onlyIDA totalIndiaIndonesiaIran, Islamic Rep.IraqIrelandIsraelItalyJamaicaJapanJordanKazakhstanKenyaKiribatiKorea, Rep.KuwaitKyrgyz RepublicLao PDRLate-demographic dividendLatin America & Caribbean Latin America & Caribbean (excluding high income)Latin America & the Caribbean (IDA & IBRD countries)LatviaLeast developed countries: UN classificationLebanonLesothoLiberiaLibyaLiechtensteinLithuaniaLow & middle incomeLow incomeLower middle incomeLuxembourgMacao SAR, ChinaMacedonia, FYRMadagascarMalawiMalaysiaMaldivesMaliMaltaMarshall IslandsMauritaniaMauritiusMexicoMicronesia, Fed. Sts.Middle East & North AfricaMiddle East & North Africa (excluding high income)Middle East & North Africa (IDA & IBRD countries)Middle incomeMoldovaMongoliaMontenegroMoroccoMozambiqueMyanmarNamibiaNauruNepalNetherlandsNew ZealandNicaraguaNigerNigeriaNorth AmericaNorwayOECD membersOmanOther small statesPacific island small statesPakistanPalauPanamaPapua New GuineaParaguayPeruPhilippinesPolandPortugalPost-demographic dividendPre-demographic dividendQatarRomaniaRussian FederationRwandaSamoaSao Tome and PrincipeSaudi ArabiaSenegalSerbiaSeychellesSierra LeoneSingaporeSlovak RepublicSloveniaSmall statesSolomon IslandsSouth AfricaSouth AsiaSouth Asia (IDA & IBRD)South SudanSpainSri LankaSt. Kitts and NevisSt. LuciaSt. Vincent and the GrenadinesSub-Saharan Africa Sub-Saharan Africa (excluding high income)Sub-Saharan Africa (IDA & IBRD countries)SudanSurinameSwazilandSwedenSwitzerlandTajikistanTanzaniaThailandTimor-LesteTogoTongaTrinidad and TobagoTunisiaTurkeyTurkmenistanUgandaUkraineUnited Arab EmiratesUnited KingdomUnited StatesUpper middle incomeUruguayUzbekistanVanuatuVenezuela, RBVietnamWest Bank and GazaWorldYemen, Rep.ZambiaZimbabwe Timeline:
This timeline shows a graph from 1969 to 2014 of Middle East & North Africa. No data until 1968. Number of actual observations by date: 46.
Source name:
World Development Indicators
Source organization:
Carbon Dioxide Information Analysis Center, Environmental Sciences Division, Oak Ridge National Laboratory, Tennessee, United States.
Categories, topics:
Climate Change, Environment
Last updated:
apr 23, 2017
Indicators value changes by year
At the date of observation
Value
Absolute change
Change from previous value
jan 1, 1969
0.643
+0.643
0.0%
jan 1, 1970
0.654
+0.011
1.73%
jan 1, 1971
0.634
-0.02
-3.05%
jan 1, 1972
0.647
+0.013
1.99%
jan 1, 1973
0.603
-0.044
-6.75%
jan 1, 1974
0.653
+0.049
8.14%
jan 1, 1975
0.597
-0.056
-8.57%
jan 1, 1976
0.575
-0.022
-3.66%
jan 1, 1977
0.597
+0.022
3.79%
jan 1, 1978
0.604
+0.008
1.27%
jan 1, 1979
0.654
+0.05
8.29%
jan 1, 1980
0.663
+0.009
1.37%
jan 1, 1981
0.66
-0.003
-0.46%
jan 1, 1982
0.628
-0.032
-4.88%
jan 1, 1983
0.623
-0.005
-0.76%
jan 1, 1984
0.661
+0.038
6.05%
jan 1, 1985
0.71
+0.049
7.45%
jan 1, 1986
0.748
+0.038
5.41%
jan 1, 1987
0.811
+0.062
8.35%
jan 1, 1988
0.816
+0.005
0.6%
jan 1, 1989
0.857
+0.041
5.06%
jan 1, 1990
0.861
+0.004
0.48%
jan 1, 1991
0.801
-0.06
-6.97%
jan 1, 1992
0.829
+0.028
3.48%
jan 1, 1993
0.844
+0.015
1.83%
jan 1, 1994
0.889
+0.045
5.34%
jan 1, 1995
0.907
+0.018
1.99%
jan 1, 1996
0.86
-0.047
-5.16%
jan 1, 1997
0.816
-0.044
-5.15%
jan 1, 1998
0.761
-0.055
-6.75%
jan 1, 1999
0.799
+0.038
4.97%
jan 1, 2000
0.828
+0.03
3.7%
jan 1, 2001
0.853
+0.025
3.04%
jan 1, 2002
0.851
-0.003
-0.31%
jan 1, 2003
0.842
-0.009
-1.0%
jan 1, 2004
0.858
+0.016
1.87%
jan 1, 2005
0.856
-0.002
-0.24%
jan 1, 2006
0.85
-0.006
-0.71%
jan 1, 2007
0.843
-0.007
-0.84%
jan 1, 2008
0.805
-0.037
-4.44%
jan 1, 2009
0.828
+0.022
2.79%
jan 1, 2010
0.852
+0.024
2.92%
jan 1, 2011
0.841
-0.011
-1.25%
jan 1, 2012
0.817
-0.024
-2.85%
jan 1, 2013
0.852
+0.034
4.18%
jan 1, 2014
0.811
-0.041
-4.82%
Ranking of countries by current statistics by years


Comments: