29
/
en
AIzaSyAYiBZKx7MnpbEhh9jyipgxe19OcubqV5w
April 1, 2024
181896
Luxembourg
LUX
true
2
1
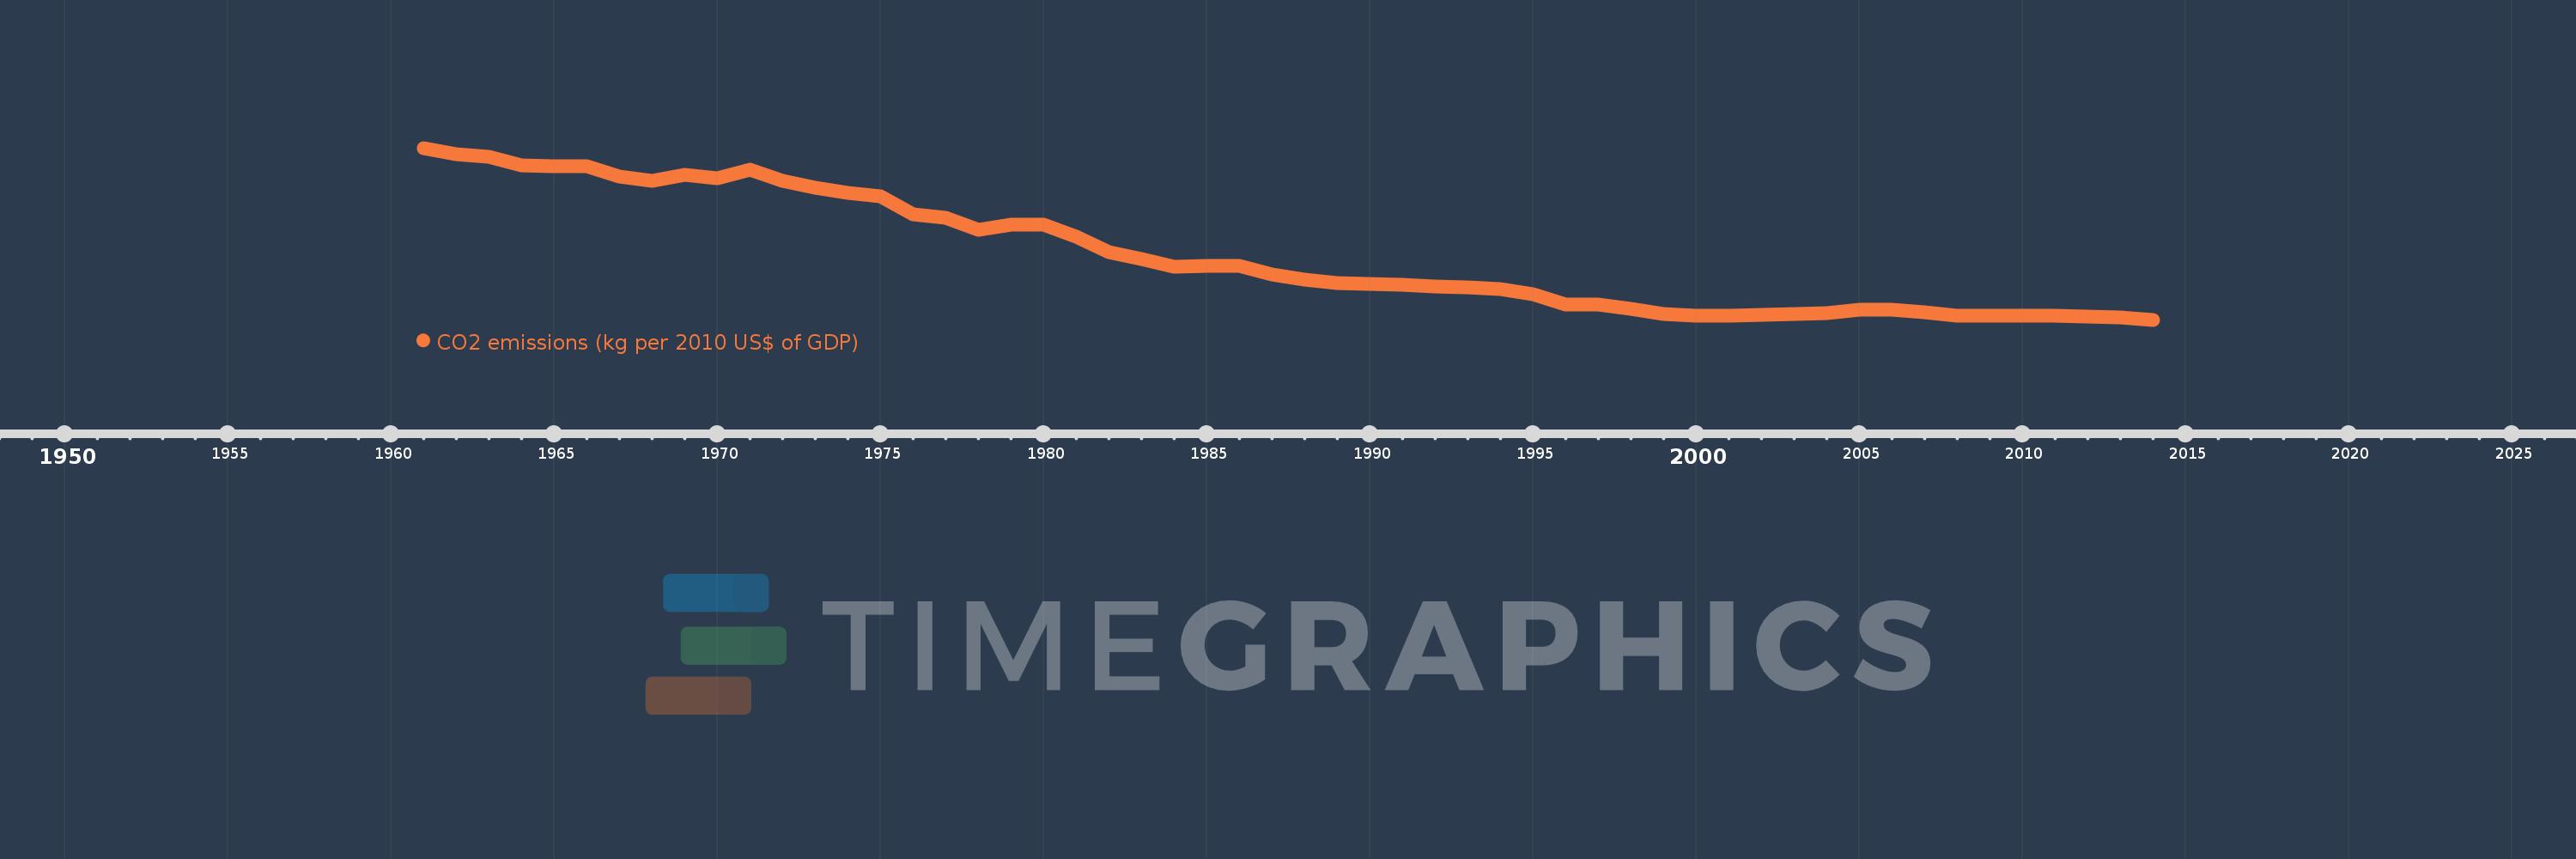
CO2 emissions (kg per 2010 US$ of GDP)
2014,2013,2012,2011,2010,2009,2008,2007,2006,2005,2004,2003,2002,2001,2000,1999,1998,1997,1996,1995,1994,1993,1992,1991,1990,1989,1988,1987,1986,1985,1984,1983,1982,1981,1980,1979,1978,1977,1976,1975,1974,1973,1972,1971,1970,1969,1968,1967,1966,1965,1964,1963,1962,1961
This statistics in other country:
AfghanistanAlbaniaAlgeriaAndorraAngolaAntigua and BarbudaArab WorldArgentinaArmeniaArubaAustraliaAustriaAzerbaijanBahamas, TheBahrainBangladeshBarbadosBelarusBelgiumBelizeBeninBermudaBhutanBoliviaBosnia and HerzegovinaBotswanaBrazilBrunei DarussalamBulgariaBurkina FasoBurundiCabo VerdeCambodiaCameroonCanadaCaribbean small statesCentral African RepublicCentral Europe and the BalticsChadChileChinaColombiaComorosCongo, Dem. Rep.Congo, Rep.Costa RicaCote d'IvoireCroatiaCubaCyprusCzech RepublicDenmarkDjiboutiDominicaDominican RepublicEarly-demographic dividendEast Asia & PacificEast Asia & Pacific (excluding high income)East Asia & Pacific (IDA & IBRD countries)EcuadorEgypt, Arab Rep.El SalvadorEquatorial GuineaEritreaEstoniaEthiopiaEuro areaEurope & Central AsiaEurope & Central Asia (excluding high income)Europe & Central Asia (IDA & IBRD countries)European UnionFaroe IslandsFijiFinlandFragile and conflict affected situationsFranceGabonGambia, TheGeorgiaGermanyGhanaGreeceGreenlandGrenadaGuatemalaGuineaGuinea-BissauGuyanaHaitiHeavily indebted poor countries (HIPC)High incomeHondurasHong Kong SAR, ChinaHungaryIBRD onlyIcelandIDA & IBRD totalIDA blendIDA onlyIDA totalIndiaIndonesiaIran, Islamic Rep.IraqIrelandIsraelItalyJamaicaJapanJordanKazakhstanKenyaKiribatiKorea, Rep.KuwaitKyrgyz RepublicLao PDRLate-demographic dividendLatin America & Caribbean Latin America & Caribbean (excluding high income)Latin America & the Caribbean (IDA & IBRD countries)LatviaLeast developed countries: UN classificationLebanonLesothoLiberiaLibyaLiechtensteinLithuaniaLow & middle incomeLow incomeLower middle incomeLuxembourgMacao SAR, ChinaMacedonia, FYRMadagascarMalawiMalaysiaMaldivesMaliMaltaMarshall IslandsMauritaniaMauritiusMexicoMicronesia, Fed. Sts.Middle East & North AfricaMiddle East & North Africa (excluding high income)Middle East & North Africa (IDA & IBRD countries)Middle incomeMoldovaMongoliaMontenegroMoroccoMozambiqueMyanmarNamibiaNauruNepalNetherlandsNew ZealandNicaraguaNigerNigeriaNorth AmericaNorwayOECD membersOmanOther small statesPacific island small statesPakistanPalauPanamaPapua New GuineaParaguayPeruPhilippinesPolandPortugalPost-demographic dividendPre-demographic dividendQatarRomaniaRussian FederationRwandaSamoaSao Tome and PrincipeSaudi ArabiaSenegalSerbiaSeychellesSierra LeoneSingaporeSlovak RepublicSloveniaSmall statesSolomon IslandsSouth AfricaSouth AsiaSouth Asia (IDA & IBRD)South SudanSpainSri LankaSt. Kitts and NevisSt. LuciaSt. Vincent and the GrenadinesSub-Saharan Africa Sub-Saharan Africa (excluding high income)Sub-Saharan Africa (IDA & IBRD countries)SudanSurinameSwazilandSwedenSwitzerlandTajikistanTanzaniaThailandTimor-LesteTogoTongaTrinidad and TobagoTunisiaTurkeyTurkmenistanUgandaUkraineUnited Arab EmiratesUnited KingdomUnited StatesUpper middle incomeUruguayUzbekistanVanuatuVenezuela, RBVietnamWest Bank and GazaWorldYemen, Rep.ZambiaZimbabwe Timeline:
This timeline shows a graph from 1961 to 2014 of Luxembourg. No data until 1960. Number of actual observations by date: 54.
Source name:
World Development Indicators
Source organization:
Carbon Dioxide Information Analysis Center, Environmental Sciences Division, Oak Ridge National Laboratory, Tennessee, United States.
Categories, topics:
Climate Change, Environment
Last updated:
apr 23, 2017
Indicators value changes by year
At the date of observation
Value
Absolute change
Change from previous value
jan 1, 1961
1.354
+1.354
0.0%
jan 1, 1962
1.313
-0.042
-3.08%
jan 1, 1963
1.291
-0.022
-1.68%
jan 1, 1964
1.237
-0.054
-4.18%
jan 1, 1965
1.232
-0.004
-0.34%
jan 1, 1966
1.231
-0.001
-0.1%
jan 1, 1967
1.159
-0.072
-5.82%
jan 1, 1968
1.131
-0.028
-2.45%
jan 1, 1969
1.173
+0.041
3.67%
jan 1, 1970
1.146
-0.026
-2.22%
jan 1, 1971
1.207
+0.06
5.25%
jan 1, 1972
1.129
-0.078
-6.47%
jan 1, 1973
1.082
-0.046
-4.11%
jan 1, 1974
1.049
-0.033
-3.06%
jan 1, 1975
1.024
-0.025
-2.4%
jan 1, 1976
0.901
-0.123
-12.03%
jan 1, 1977
0.878
-0.023
-2.5%
jan 1, 1978
0.798
-0.08
-9.14%
jan 1, 1979
0.831
+0.033
4.18%
jan 1, 1980
0.831
0.0
-0.02%
jan 1, 1981
0.75
-0.081
-9.8%
jan 1, 1982
0.645
-0.105
-14.03%
jan 1, 1983
0.599
-0.046
-7.08%
jan 1, 1984
0.544
-0.055
-9.13%
jan 1, 1985
0.552
+0.008
1.42%
jan 1, 1986
0.551
-0.001
-0.12%
jan 1, 1987
0.493
-0.059
-10.64%
jan 1, 1988
0.456
-0.037
-7.44%
jan 1, 1989
0.433
-0.023
-5.03%
jan 1, 1990
0.427
-0.006
-1.48%
jan 1, 1991
0.419
-0.007
-1.66%
jan 1, 1992
0.41
-0.01
-2.32%
jan 1, 1993
0.401
-0.009
-2.19%
jan 1, 1994
0.392
-0.008
-2.07%
jan 1, 1995
0.357
-0.035
-9.02%
jan 1, 1996
0.287
-0.07
-19.54%
jan 1, 1997
0.286
-0.001
-0.46%
jan 1, 1998
0.255
-0.031
-10.88%
jan 1, 1999
0.221
-0.033
-13.11%
jan 1, 2000
0.213
-0.009
-3.85%
jan 1, 2001
0.209
-0.004
-2.07%
jan 1, 2002
0.215
+0.007
3.12%
jan 1, 2003
0.222
+0.007
3.26%
jan 1, 2004
0.23
+0.008
3.73%
jan 1, 2005
0.251
+0.021
8.97%
jan 1, 2006
0.249
-0.002
-0.72%
jan 1, 2007
0.233
-0.016
-6.49%
jan 1, 2008
0.209
-0.024
-10.43%
jan 1, 2009
0.209
+0.0
0.11%
jan 1, 2010
0.21
+0.001
0.4%
jan 1, 2011
0.21
0.0
-0.13%
jan 1, 2012
0.204
-0.006
-2.76%
jan 1, 2013
0.2
-0.003
-1.68%
jan 1, 2014
0.183
-0.017
-8.68%
Ranking of countries by current statistics by years


Comments: