29
/
en
AIzaSyAYiBZKx7MnpbEhh9jyipgxe19OcubqV5w
April 1, 2024
42759
Latin America & Caribbean (excluding high income)
LAC
false
2
1
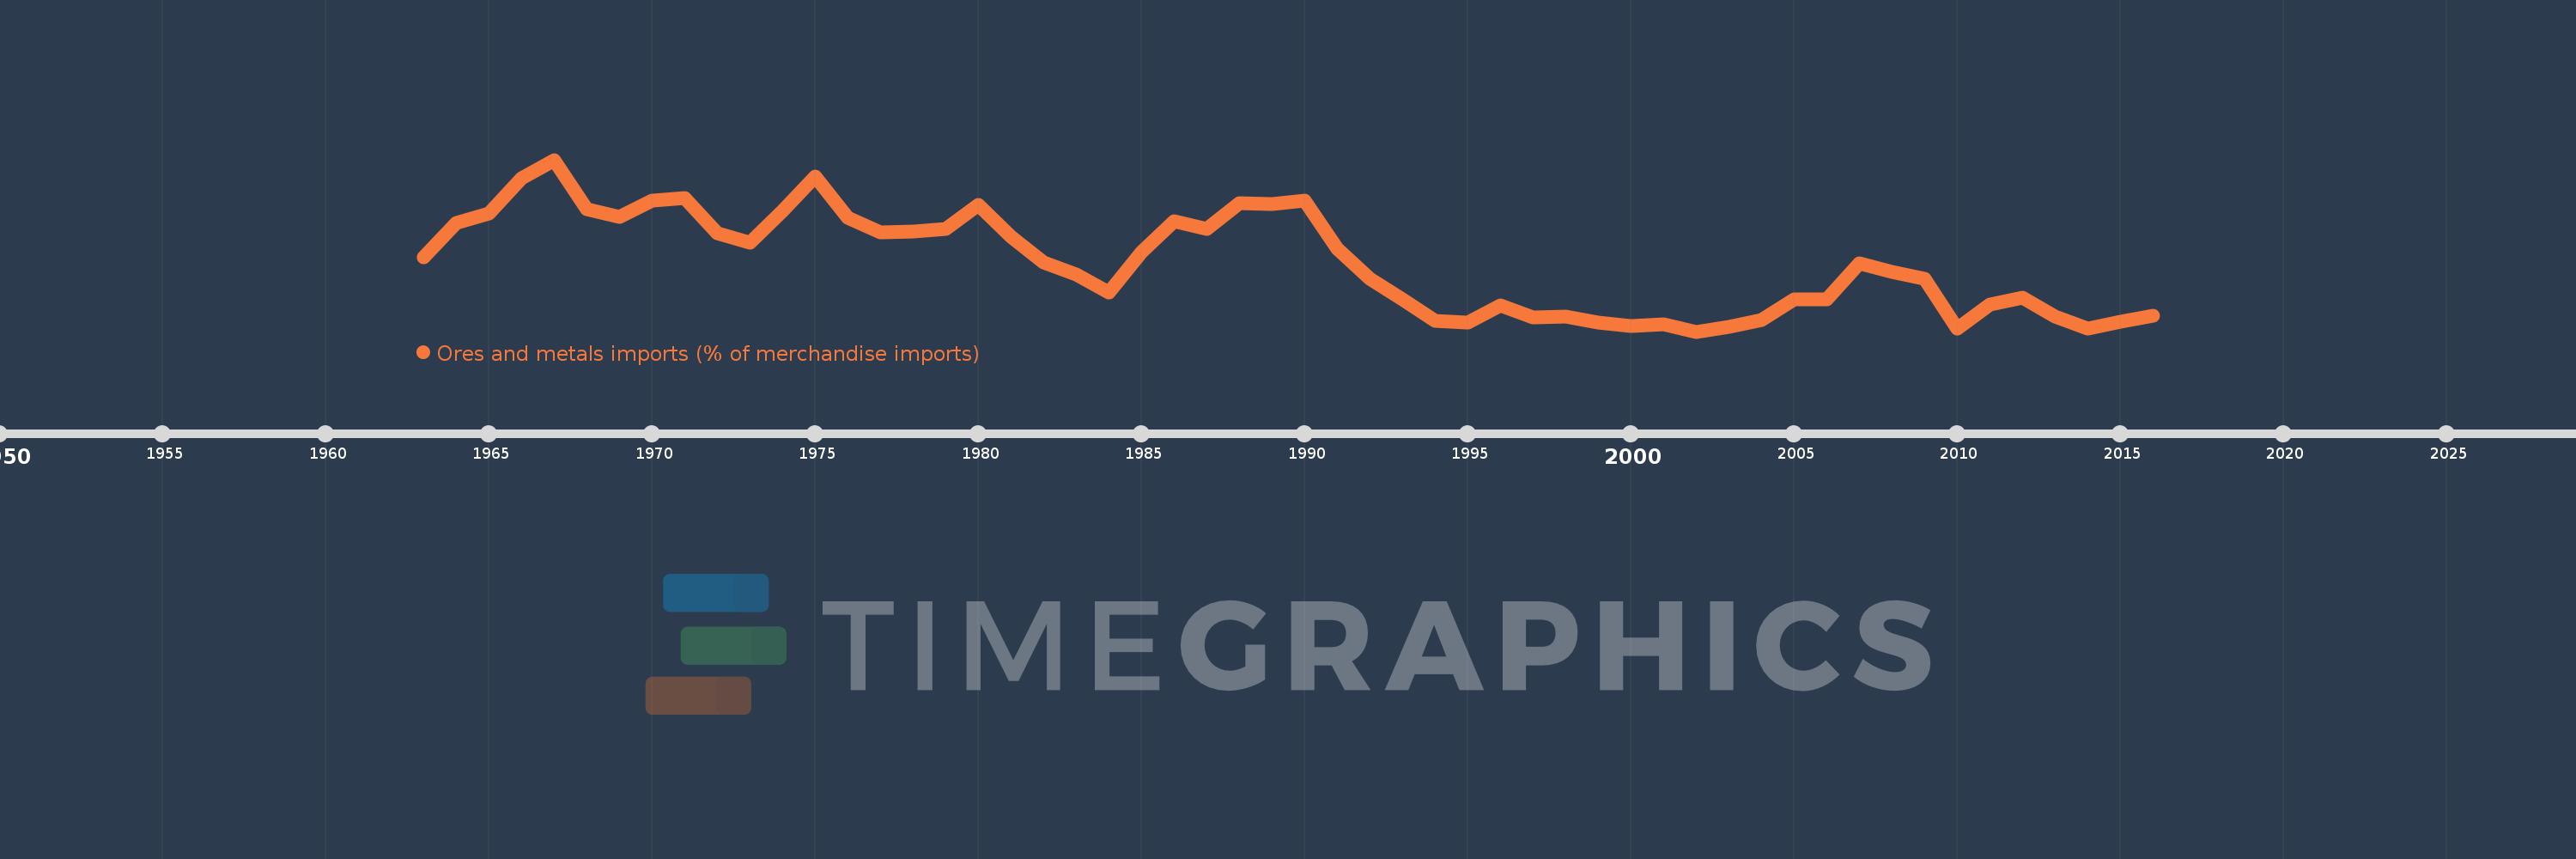
Ores and metals imports (% of merchandise imports)
2016,2015,2014,2013,2012,2011,2010,2009,2008,2007,2006,2005,2004,2003,2002,2001,2000,1999,1998,1997,1996,1995,1994,1993,1992,1991,1990,1989,1988,1987,1986,1985,1984,1983,1982,1981,1980,1979,1978,1977,1976,1975,1974,1973,1972,1971,1970,1969,1968,1967,1966,1965,1964,1963
This statistics in other country:
AfghanistanAlbaniaAlgeriaAndorraAngolaAntigua and BarbudaArab WorldArgentinaArmeniaArubaAustraliaAustriaAzerbaijanBahamas, TheBahrainBangladeshBarbadosBelarusBelgiumBelizeBeninBermudaBhutanBoliviaBosnia and HerzegovinaBotswanaBrazilBrunei DarussalamBulgariaBurkina FasoBurundiCabo VerdeCambodiaCameroonCanadaCaribbean small statesCayman IslandsCentral African RepublicCentral Europe and the BalticsChadChileChinaColombiaComorosCongo, Dem. Rep.Congo, Rep.Costa RicaCote d'IvoireCroatiaCubaCyprusCzech RepublicDenmarkDjiboutiDominicaDominican RepublicEarly-demographic dividendEast Asia & PacificEast Asia & Pacific (excluding high income)East Asia & Pacific (IDA & IBRD countries)EcuadorEgypt, Arab Rep.El SalvadorEquatorial GuineaEritreaEstoniaEthiopiaEuro areaEurope & Central AsiaEurope & Central Asia (excluding high income)Europe & Central Asia (IDA & IBRD countries)European UnionFaroe IslandsFijiFinlandFragile and conflict affected situationsFranceFrench PolynesiaGabonGambia, TheGeorgiaGermanyGhanaGreeceGreenlandGrenadaGuatemalaGuineaGuinea-BissauGuyanaHaitiHeavily indebted poor countries (HIPC)High incomeHondurasHong Kong SAR, ChinaHungaryIBRD onlyIcelandIDA & IBRD totalIDA blendIDA onlyIDA totalIndiaIndonesiaIran, Islamic Rep.IraqIrelandIsraelItalyJamaicaJapanJordanKazakhstanKenyaKiribatiKorea, Rep.KuwaitKyrgyz RepublicLao PDRLate-demographic dividendLatin America & Caribbean Latin America & Caribbean (excluding high income)Latin America & the Caribbean (IDA & IBRD countries)LatviaLeast developed countries: UN classificationLebanonLesothoLiberiaLibyaLithuaniaLow & middle incomeLow incomeLower middle incomeLuxembourgMacao SAR, ChinaMacedonia, FYRMadagascarMalawiMalaysiaMaldivesMaliMaltaMauritaniaMauritiusMexicoMiddle East & North AfricaMiddle East & North Africa (excluding high income)Middle East & North Africa (IDA & IBRD countries)Middle incomeMoldovaMongoliaMoroccoMozambiqueMyanmarNamibiaNepalNetherlandsNew CaledoniaNew ZealandNicaraguaNigerNigeriaNorth AmericaNorwayOECD membersOmanOther small statesPacific island small statesPakistanPalauPanamaPapua New GuineaParaguayPeruPhilippinesPolandPortugalPost-demographic dividendPre-demographic dividendQatarRomaniaRussian FederationRwandaSamoaSao Tome and PrincipeSaudi ArabiaSenegalSerbiaSeychellesSierra LeoneSingaporeSlovak RepublicSloveniaSmall statesSolomon IslandsSomaliaSouth AfricaSouth AsiaSouth Asia (IDA & IBRD)SpainSri LankaSt. Kitts and NevisSt. LuciaSt. Vincent and the GrenadinesSub-Saharan Africa Sub-Saharan Africa (excluding high income)Sub-Saharan Africa (IDA & IBRD countries)SudanSurinameSwazilandSwedenSwitzerlandSyrian Arab RepublicTajikistanTanzaniaThailandTimor-LesteTogoTongaTrinidad and TobagoTunisiaTurkeyTurkmenistanTurks and Caicos IslandsTuvaluUgandaUkraineUnited Arab EmiratesUnited KingdomUnited StatesUpper middle incomeUruguayVanuatuVenezuela, RBVietnamVirgin Islands (U.S.)WorldYemen, Rep.ZambiaZimbabwe Timeline:
This timeline shows a graph from 1963 to 2016 of Latin America & Caribbean (excluding high income). No data until 1962. Number of actual observations by date: 54.
Source name:
World Development Indicators
Source organization:
World Bank staff estimates from the Comtrade database maintained by the United Nations Statistics Division.
Categories, topics:
Energy & Mining, Private Sector, Trade
Last updated:
apr 23, 2017
Indicators value changes by year
At the date of observation
Value
Absolute change
Change from previous value
jan 1, 1963
3.255
+3.255
0.0%
jan 1, 1964
3.825
+0.571
17.53%
jan 1, 1965
3.972
+0.147
3.84%
jan 1, 1966
4.556
+0.584
14.71%
jan 1, 1967
4.866
+0.309
6.78%
jan 1, 1968
4.047
-0.818
-16.82%
jan 1, 1969
3.929
-0.118
-2.93%
jan 1, 1970
4.197
+0.268
6.82%
jan 1, 1971
4.24
+0.043
1.03%
jan 1, 1972
3.656
-0.584
-13.77%
jan 1, 1973
3.497
-0.159
-4.35%
jan 1, 1974
4.024
+0.527
15.07%
jan 1, 1975
4.596
+0.572
14.21%
jan 1, 1976
3.914
-0.683
-14.85%
jan 1, 1977
3.66
-0.253
-6.47%
jan 1, 1978
3.677
+0.017
0.45%
jan 1, 1979
3.723
+0.047
1.27%
jan 1, 1980
4.126
+0.402
10.8%
jan 1, 1981
3.59
-0.535
-12.98%
jan 1, 1982
3.166
-0.424
-11.82%
jan 1, 1983
2.97
-0.196
-6.18%
jan 1, 1984
2.677
-0.293
-9.86%
jan 1, 1985
3.338
+0.66
24.66%
jan 1, 1986
3.853
+0.516
15.46%
jan 1, 1987
3.729
-0.124
-3.23%
jan 1, 1988
4.15
+0.421
11.28%
jan 1, 1989
4.131
-0.019
-0.46%
jan 1, 1990
4.191
+0.06
1.45%
jan 1, 1991
3.393
-0.797
-19.02%
jan 1, 1992
2.899
-0.494
-14.57%
jan 1, 1993
2.556
-0.343
-11.82%
jan 1, 1994
2.209
-0.348
-13.6%
jan 1, 1995
2.182
-0.027
-1.21%
jan 1, 1996
2.465
+0.283
12.97%
jan 1, 1997
2.266
-0.198
-8.04%
jan 1, 1998
2.281
+0.015
0.65%
jan 1, 1999
2.174
-0.108
-4.71%
jan 1, 2000
2.121
-0.052
-2.4%
jan 1, 2001
2.153
+0.031
1.48%
jan 1, 2002
2.027
-0.126
-5.84%
jan 1, 2003
2.098
+0.071
3.52%
jan 1, 2004
2.212
+0.113
5.4%
jan 1, 2005
2.558
+0.346
15.63%
jan 1, 2006
2.565
+0.008
0.29%
jan 1, 2007
3.152
+0.587
22.89%
jan 1, 2008
3.013
-0.14
-4.43%
jan 1, 2009
2.907
-0.105
-3.5%
jan 1, 2010
2.082
-0.826
-28.4%
jan 1, 2011
2.472
+0.39
18.75%
jan 1, 2012
2.588
+0.116
4.7%
jan 1, 2013
2.279
-0.31
-11.96%
jan 1, 2014
2.072
-0.207
-9.07%
jan 1, 2015
2.19
+0.118
5.7%
jan 1, 2016
2.287
+0.097
4.44%
Ranking of countries by current statistics by years


Comments: