29
/
en
AIzaSyAYiBZKx7MnpbEhh9jyipgxe19OcubqV5w
April 1, 2024
33737
European Union
EUU
false
2
1
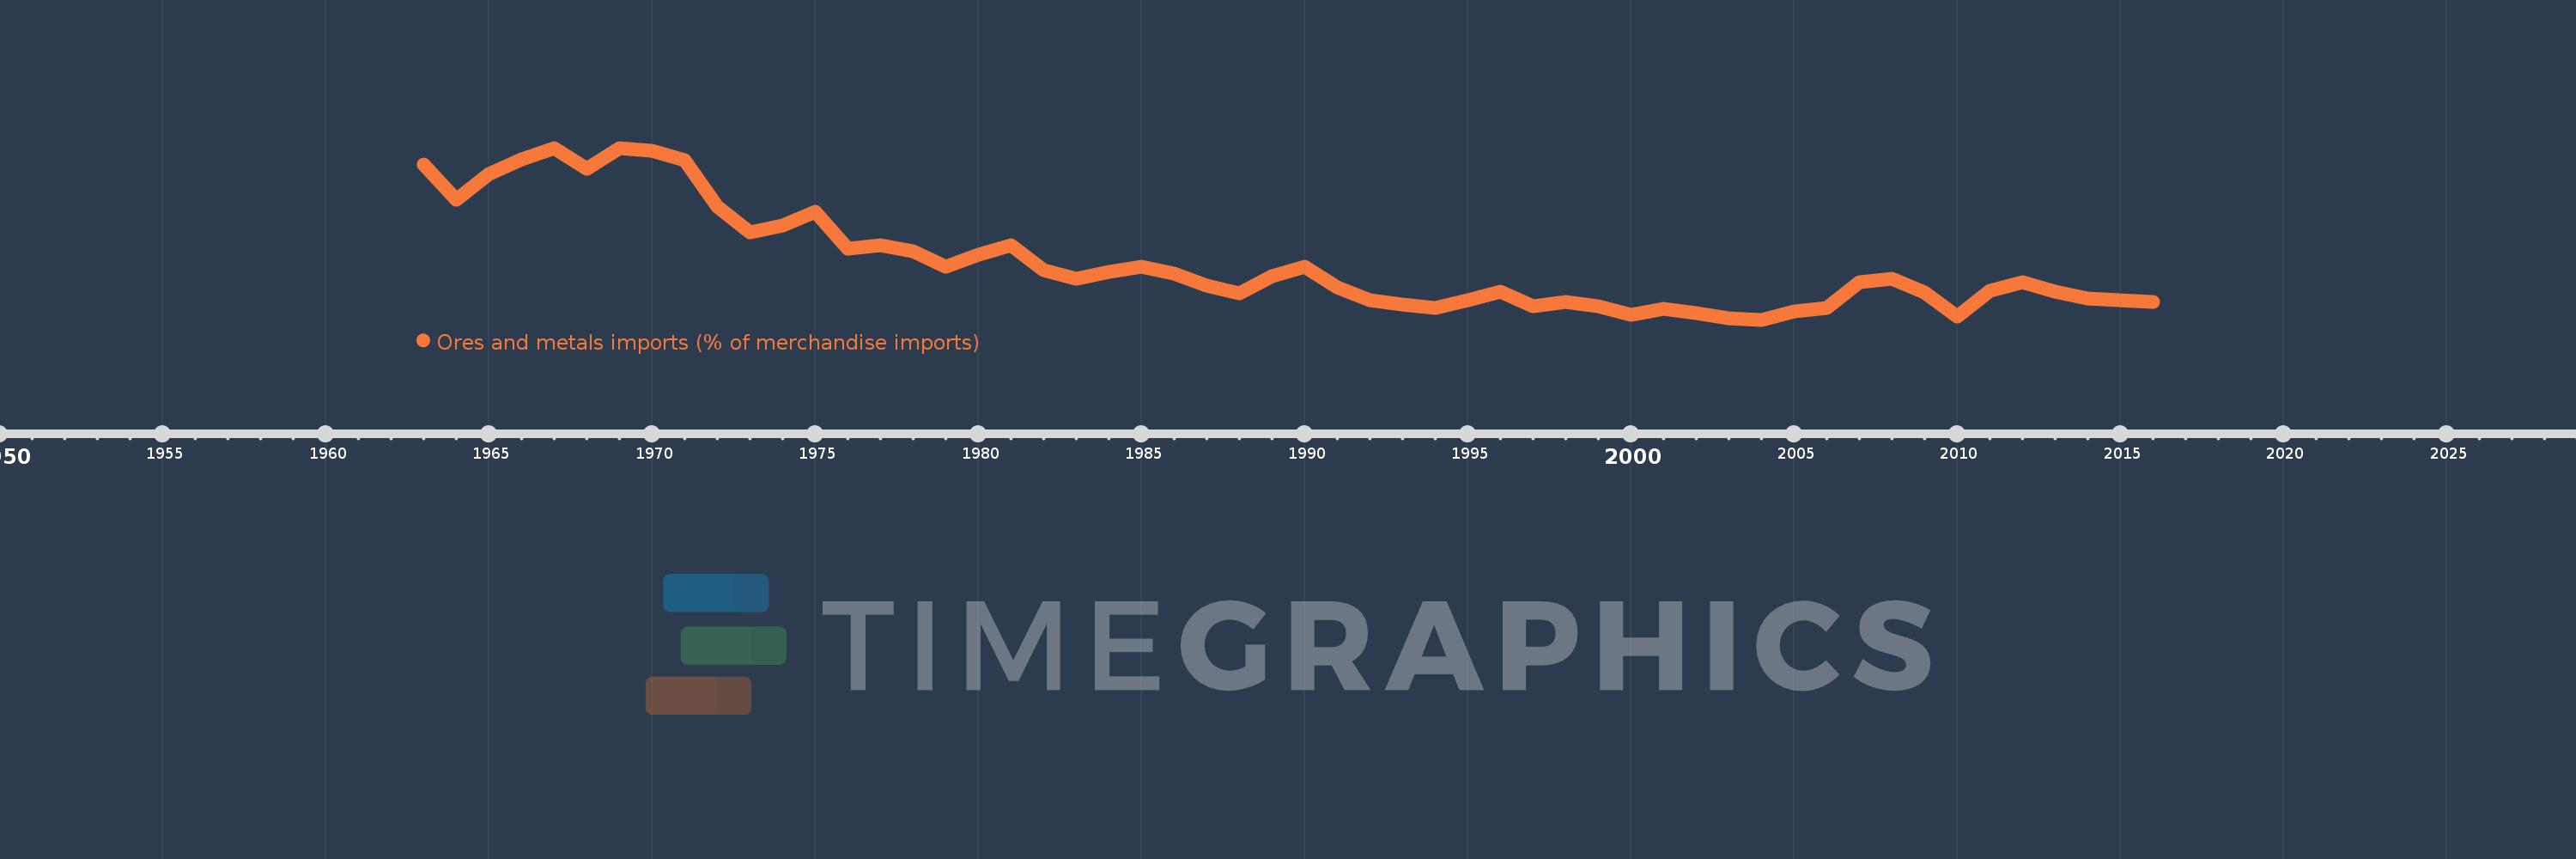
Ores and metals imports (% of merchandise imports)
2016,2015,2014,2013,2012,2011,2010,2009,2008,2007,2006,2005,2004,2003,2002,2001,2000,1999,1998,1997,1996,1995,1994,1993,1992,1991,1990,1989,1988,1987,1986,1985,1984,1983,1982,1981,1980,1979,1978,1977,1976,1975,1974,1973,1972,1971,1970,1969,1968,1967,1966,1965,1964,1963
This statistics in other country:
AfghanistanAlbaniaAlgeriaAndorraAngolaAntigua and BarbudaArab WorldArgentinaArmeniaArubaAustraliaAustriaAzerbaijanBahamas, TheBahrainBangladeshBarbadosBelarusBelgiumBelizeBeninBermudaBhutanBoliviaBosnia and HerzegovinaBotswanaBrazilBrunei DarussalamBulgariaBurkina FasoBurundiCabo VerdeCambodiaCameroonCanadaCaribbean small statesCayman IslandsCentral African RepublicCentral Europe and the BalticsChadChileChinaColombiaComorosCongo, Dem. Rep.Congo, Rep.Costa RicaCote d'IvoireCroatiaCubaCyprusCzech RepublicDenmarkDjiboutiDominicaDominican RepublicEarly-demographic dividendEast Asia & PacificEast Asia & Pacific (excluding high income)East Asia & Pacific (IDA & IBRD countries)EcuadorEgypt, Arab Rep.El SalvadorEquatorial GuineaEritreaEstoniaEthiopiaEuro areaEurope & Central AsiaEurope & Central Asia (excluding high income)Europe & Central Asia (IDA & IBRD countries)European UnionFaroe IslandsFijiFinlandFragile and conflict affected situationsFranceFrench PolynesiaGabonGambia, TheGeorgiaGermanyGhanaGreeceGreenlandGrenadaGuatemalaGuineaGuinea-BissauGuyanaHaitiHeavily indebted poor countries (HIPC)High incomeHondurasHong Kong SAR, ChinaHungaryIBRD onlyIcelandIDA & IBRD totalIDA blendIDA onlyIDA totalIndiaIndonesiaIran, Islamic Rep.IraqIrelandIsraelItalyJamaicaJapanJordanKazakhstanKenyaKiribatiKorea, Rep.KuwaitKyrgyz RepublicLao PDRLate-demographic dividendLatin America & Caribbean Latin America & Caribbean (excluding high income)Latin America & the Caribbean (IDA & IBRD countries)LatviaLeast developed countries: UN classificationLebanonLesothoLiberiaLibyaLithuaniaLow & middle incomeLow incomeLower middle incomeLuxembourgMacao SAR, ChinaMacedonia, FYRMadagascarMalawiMalaysiaMaldivesMaliMaltaMauritaniaMauritiusMexicoMiddle East & North AfricaMiddle East & North Africa (excluding high income)Middle East & North Africa (IDA & IBRD countries)Middle incomeMoldovaMongoliaMoroccoMozambiqueMyanmarNamibiaNepalNetherlandsNew CaledoniaNew ZealandNicaraguaNigerNigeriaNorth AmericaNorwayOECD membersOmanOther small statesPacific island small statesPakistanPalauPanamaPapua New GuineaParaguayPeruPhilippinesPolandPortugalPost-demographic dividendPre-demographic dividendQatarRomaniaRussian FederationRwandaSamoaSao Tome and PrincipeSaudi ArabiaSenegalSerbiaSeychellesSierra LeoneSingaporeSlovak RepublicSloveniaSmall statesSolomon IslandsSomaliaSouth AfricaSouth AsiaSouth Asia (IDA & IBRD)SpainSri LankaSt. Kitts and NevisSt. LuciaSt. Vincent and the GrenadinesSub-Saharan Africa Sub-Saharan Africa (excluding high income)Sub-Saharan Africa (IDA & IBRD countries)SudanSurinameSwazilandSwedenSwitzerlandSyrian Arab RepublicTajikistanTanzaniaThailandTimor-LesteTogoTongaTrinidad and TobagoTunisiaTurkeyTurkmenistanTurks and Caicos IslandsTuvaluUgandaUkraineUnited Arab EmiratesUnited KingdomUnited StatesUpper middle incomeUruguayVanuatuVenezuela, RBVietnamVirgin Islands (U.S.)WorldYemen, Rep.ZambiaZimbabwe Timeline:
This timeline shows a graph from 1963 to 2016 of European Union. No data until 1962. Number of actual observations by date: 54.
Source name:
World Development Indicators
Source organization:
World Bank staff estimates from the Comtrade database maintained by the United Nations Statistics Division.
Categories, topics:
Energy & Mining, Private Sector, Trade
Last updated:
apr 23, 2017
Indicators value changes by year
At the date of observation
Value
Absolute change
Change from previous value
jan 1, 1963
8.842
+8.842
0.0%
jan 1, 1964
7.476
-1.366
-15.45%
jan 1, 1965
8.501
+1.025
13.71%
jan 1, 1966
9.064
+0.563
6.62%
jan 1, 1967
9.501
+0.436
4.81%
jan 1, 1968
8.682
-0.819
-8.62%
jan 1, 1969
9.499
+0.818
9.42%
jan 1, 1970
9.392
-0.107
-1.13%
jan 1, 1971
9.013
-0.379
-4.04%
jan 1, 1972
7.206
-1.807
-20.05%
jan 1, 1973
6.206
-1.0
-13.88%
jan 1, 1974
6.475
+0.269
4.33%
jan 1, 1975
7.024
+0.549
8.48%
jan 1, 1976
5.562
-1.462
-20.81%
jan 1, 1977
5.698
+0.137
2.46%
jan 1, 1978
5.48
-0.218
-3.83%
jan 1, 1979
4.87
-0.61
-11.14%
jan 1, 1980
5.329
+0.46
9.44%
jan 1, 1981
5.713
+0.383
7.19%
jan 1, 1982
4.736
-0.977
-17.11%
jan 1, 1983
4.424
-0.311
-6.58%
jan 1, 1984
4.667
+0.243
5.49%
jan 1, 1985
4.875
+0.208
4.45%
jan 1, 1986
4.607
-0.268
-5.49%
jan 1, 1987
4.133
-0.475
-10.3%
jan 1, 1988
3.848
-0.285
-6.9%
jan 1, 1989
4.52
+0.673
17.48%
jan 1, 1990
4.882
+0.362
8.0%
jan 1, 1991
4.086
-0.796
-16.31%
jan 1, 1992
3.585
-0.5
-12.25%
jan 1, 1993
3.39
-0.196
-5.45%
jan 1, 1994
3.265
-0.125
-3.67%
jan 1, 1995
3.573
+0.308
9.44%
jan 1, 1996
3.91
+0.336
9.41%
jan 1, 1997
3.344
-0.566
-14.48%
jan 1, 1998
3.511
+0.168
5.01%
jan 1, 1999
3.324
-0.187
-5.32%
jan 1, 2000
3.009
-0.315
-9.48%
jan 1, 2001
3.231
+0.222
7.37%
jan 1, 2002
3.068
-0.163
-5.04%
jan 1, 2003
2.886
-0.182
-5.94%
jan 1, 2004
2.813
-0.073
-2.53%
jan 1, 2005
3.147
+0.334
11.88%
jan 1, 2006
3.269
+0.122
3.89%
jan 1, 2007
4.259
+0.99
30.28%
jan 1, 2008
4.403
+0.144
3.39%
jan 1, 2009
3.857
-0.546
-12.4%
jan 1, 2010
2.93
-0.928
-24.05%
jan 1, 2011
3.956
+1.026
35.02%
jan 1, 2012
4.287
+0.332
8.38%
jan 1, 2013
3.92
-0.367
-8.56%
jan 1, 2014
3.653
-0.267
-6.82%
jan 1, 2015
3.569
-0.084
-2.31%
jan 1, 2016
3.517
-0.052
-1.45%
Ranking of countries by current statistics by years


Comments: