29
/
en
AIzaSyAYiBZKx7MnpbEhh9jyipgxe19OcubqV5w
April 1, 2024
137145
Gambia, The
GMB
true
2
1
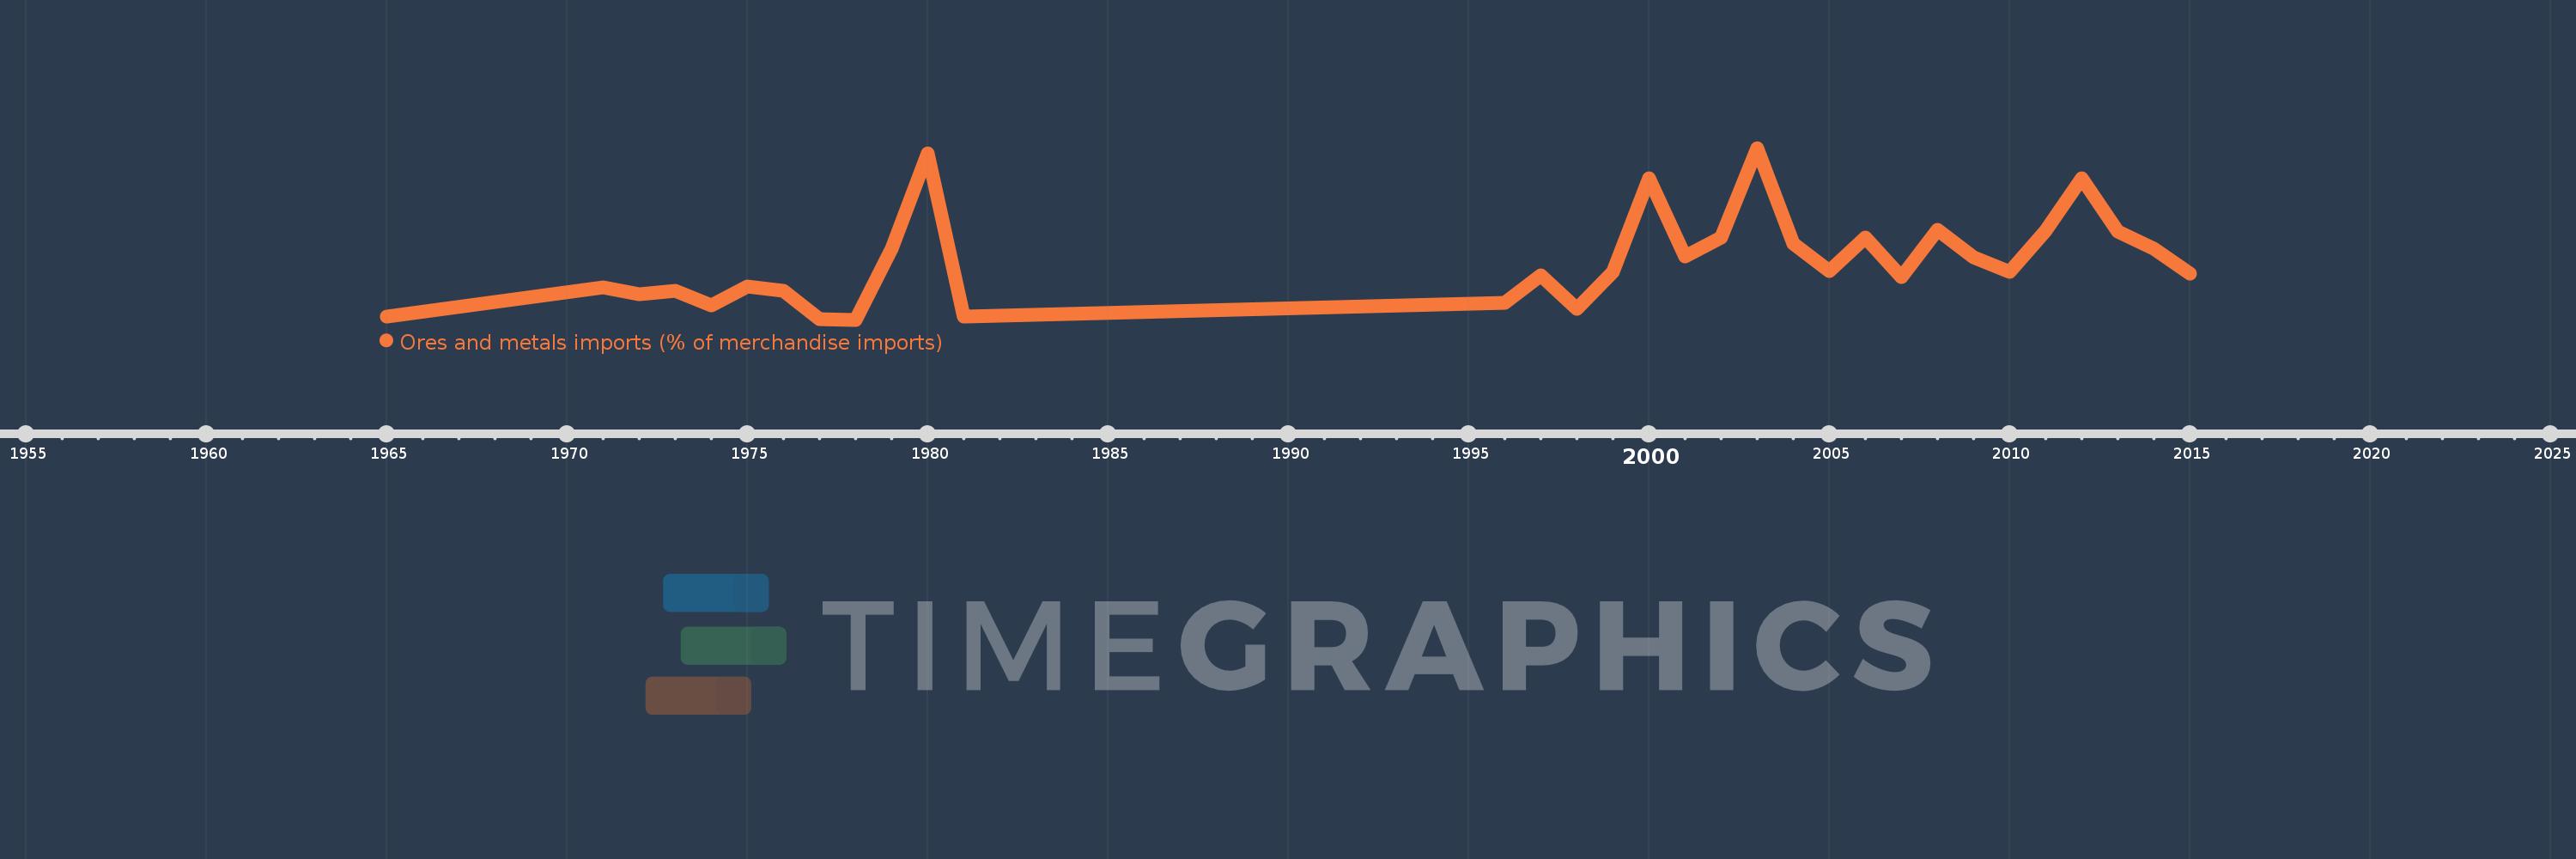
Ores and metals imports (% of merchandise imports)
2015,2014,2013,2012,2011,2010,2009,2008,2007,2006,2005,2004,2003,2002,2001,2000,1999,1998,1997,1996,1981,1980,1979,1978,1977,1976,1975,1974,1973,1972,1971,1965
This statistics in other country:
AfghanistanAlbaniaAlgeriaAndorraAngolaAntigua and BarbudaArab WorldArgentinaArmeniaArubaAustraliaAustriaAzerbaijanBahamas, TheBahrainBangladeshBarbadosBelarusBelgiumBelizeBeninBermudaBhutanBoliviaBosnia and HerzegovinaBotswanaBrazilBrunei DarussalamBulgariaBurkina FasoBurundiCabo VerdeCambodiaCameroonCanadaCaribbean small statesCayman IslandsCentral African RepublicCentral Europe and the BalticsChadChileChinaColombiaComorosCongo, Dem. Rep.Congo, Rep.Costa RicaCote d'IvoireCroatiaCubaCyprusCzech RepublicDenmarkDjiboutiDominicaDominican RepublicEarly-demographic dividendEast Asia & PacificEast Asia & Pacific (excluding high income)East Asia & Pacific (IDA & IBRD countries)EcuadorEgypt, Arab Rep.El SalvadorEquatorial GuineaEritreaEstoniaEthiopiaEuro areaEurope & Central AsiaEurope & Central Asia (excluding high income)Europe & Central Asia (IDA & IBRD countries)European UnionFaroe IslandsFijiFinlandFragile and conflict affected situationsFranceFrench PolynesiaGabonGambia, TheGeorgiaGermanyGhanaGreeceGreenlandGrenadaGuatemalaGuineaGuinea-BissauGuyanaHaitiHeavily indebted poor countries (HIPC)High incomeHondurasHong Kong SAR, ChinaHungaryIBRD onlyIcelandIDA & IBRD totalIDA blendIDA onlyIDA totalIndiaIndonesiaIran, Islamic Rep.IraqIrelandIsraelItalyJamaicaJapanJordanKazakhstanKenyaKiribatiKorea, Rep.KuwaitKyrgyz RepublicLao PDRLate-demographic dividendLatin America & Caribbean Latin America & Caribbean (excluding high income)Latin America & the Caribbean (IDA & IBRD countries)LatviaLeast developed countries: UN classificationLebanonLesothoLiberiaLibyaLithuaniaLow & middle incomeLow incomeLower middle incomeLuxembourgMacao SAR, ChinaMacedonia, FYRMadagascarMalawiMalaysiaMaldivesMaliMaltaMauritaniaMauritiusMexicoMiddle East & North AfricaMiddle East & North Africa (excluding high income)Middle East & North Africa (IDA & IBRD countries)Middle incomeMoldovaMongoliaMoroccoMozambiqueMyanmarNamibiaNepalNetherlandsNew CaledoniaNew ZealandNicaraguaNigerNigeriaNorth AmericaNorwayOECD membersOmanOther small statesPacific island small statesPakistanPalauPanamaPapua New GuineaParaguayPeruPhilippinesPolandPortugalPost-demographic dividendPre-demographic dividendQatarRomaniaRussian FederationRwandaSamoaSao Tome and PrincipeSaudi ArabiaSenegalSerbiaSeychellesSierra LeoneSingaporeSlovak RepublicSloveniaSmall statesSolomon IslandsSomaliaSouth AfricaSouth AsiaSouth Asia (IDA & IBRD)SpainSri LankaSt. Kitts and NevisSt. LuciaSt. Vincent and the GrenadinesSub-Saharan Africa Sub-Saharan Africa (excluding high income)Sub-Saharan Africa (IDA & IBRD countries)SudanSurinameSwazilandSwedenSwitzerlandSyrian Arab RepublicTajikistanTanzaniaThailandTimor-LesteTogoTongaTrinidad and TobagoTunisiaTurkeyTurkmenistanTurks and Caicos IslandsTuvaluUgandaUkraineUnited Arab EmiratesUnited KingdomUnited StatesUpper middle incomeUruguayVanuatuVenezuela, RBVietnamVirgin Islands (U.S.)WorldYemen, Rep.ZambiaZimbabwe Timeline:
This timeline shows a graph from 1965 to 2015 of Gambia, The. No data until 1964. Number of actual observations by date: 32.
Source name:
World Development Indicators
Source organization:
World Bank staff estimates from the Comtrade database maintained by the United Nations Statistics Division.
Categories, topics:
Energy & Mining, Private Sector, Trade
Last updated:
apr 23, 2017
Indicators value changes by year
At the date of observation
Value
Absolute change
Change from previous value
jan 1, 1965
0.219
+0.219
0.0%
jan 1, 1971
0.486
+0.267
122.22%
jan 1, 1972
0.422
-0.064
-13.12%
jan 1, 1973
0.456
+0.034
8.13%
jan 1, 1974
0.32
-0.136
-29.85%
jan 1, 1975
0.496
+0.176
54.88%
jan 1, 1976
0.456
-0.04
-8.16%
jan 1, 1977
0.192
-0.263
-57.77%
jan 1, 1978
0.186
-0.006
-3.27%
jan 1, 1979
0.849
+0.662
356.03%
jan 1, 1980
1.744
+0.896
105.55%
jan 1, 1981
0.214
-1.531
-87.76%
jan 1, 1996
0.348
+0.135
62.99%
jan 1, 1997
0.605
+0.257
73.75%
jan 1, 1998
0.288
-0.317
-52.46%
jan 1, 1999
0.632
+0.345
119.94%
jan 1, 2000
1.505
+0.872
137.95%
jan 1, 2001
0.776
-0.728
-48.4%
jan 1, 2002
0.951
+0.175
22.52%
jan 1, 2003
1.792
+0.841
88.4%
jan 1, 2004
0.9
-0.892
-49.78%
jan 1, 2005
0.639
-0.261
-29.0%
jan 1, 2006
0.955
+0.316
49.5%
jan 1, 2007
0.582
-0.373
-39.03%
jan 1, 2008
1.028
+0.446
76.52%
jan 1, 2009
0.773
-0.255
-24.82%
jan 1, 2010
0.637
-0.136
-17.64%
jan 1, 2011
1.017
+0.38
59.75%
jan 1, 2012
1.509
+0.492
48.39%
jan 1, 2013
1.01
-0.499
-33.05%
jan 1, 2014
0.85
-0.161
-15.89%
jan 1, 2015
0.617
-0.233
-27.41%
Ranking of countries by current statistics by years


Comments: