29
/
en
AIzaSyAYiBZKx7MnpbEhh9jyipgxe19OcubqV5w
April 1, 2024
66442
Algeria
DZA
true
2
1
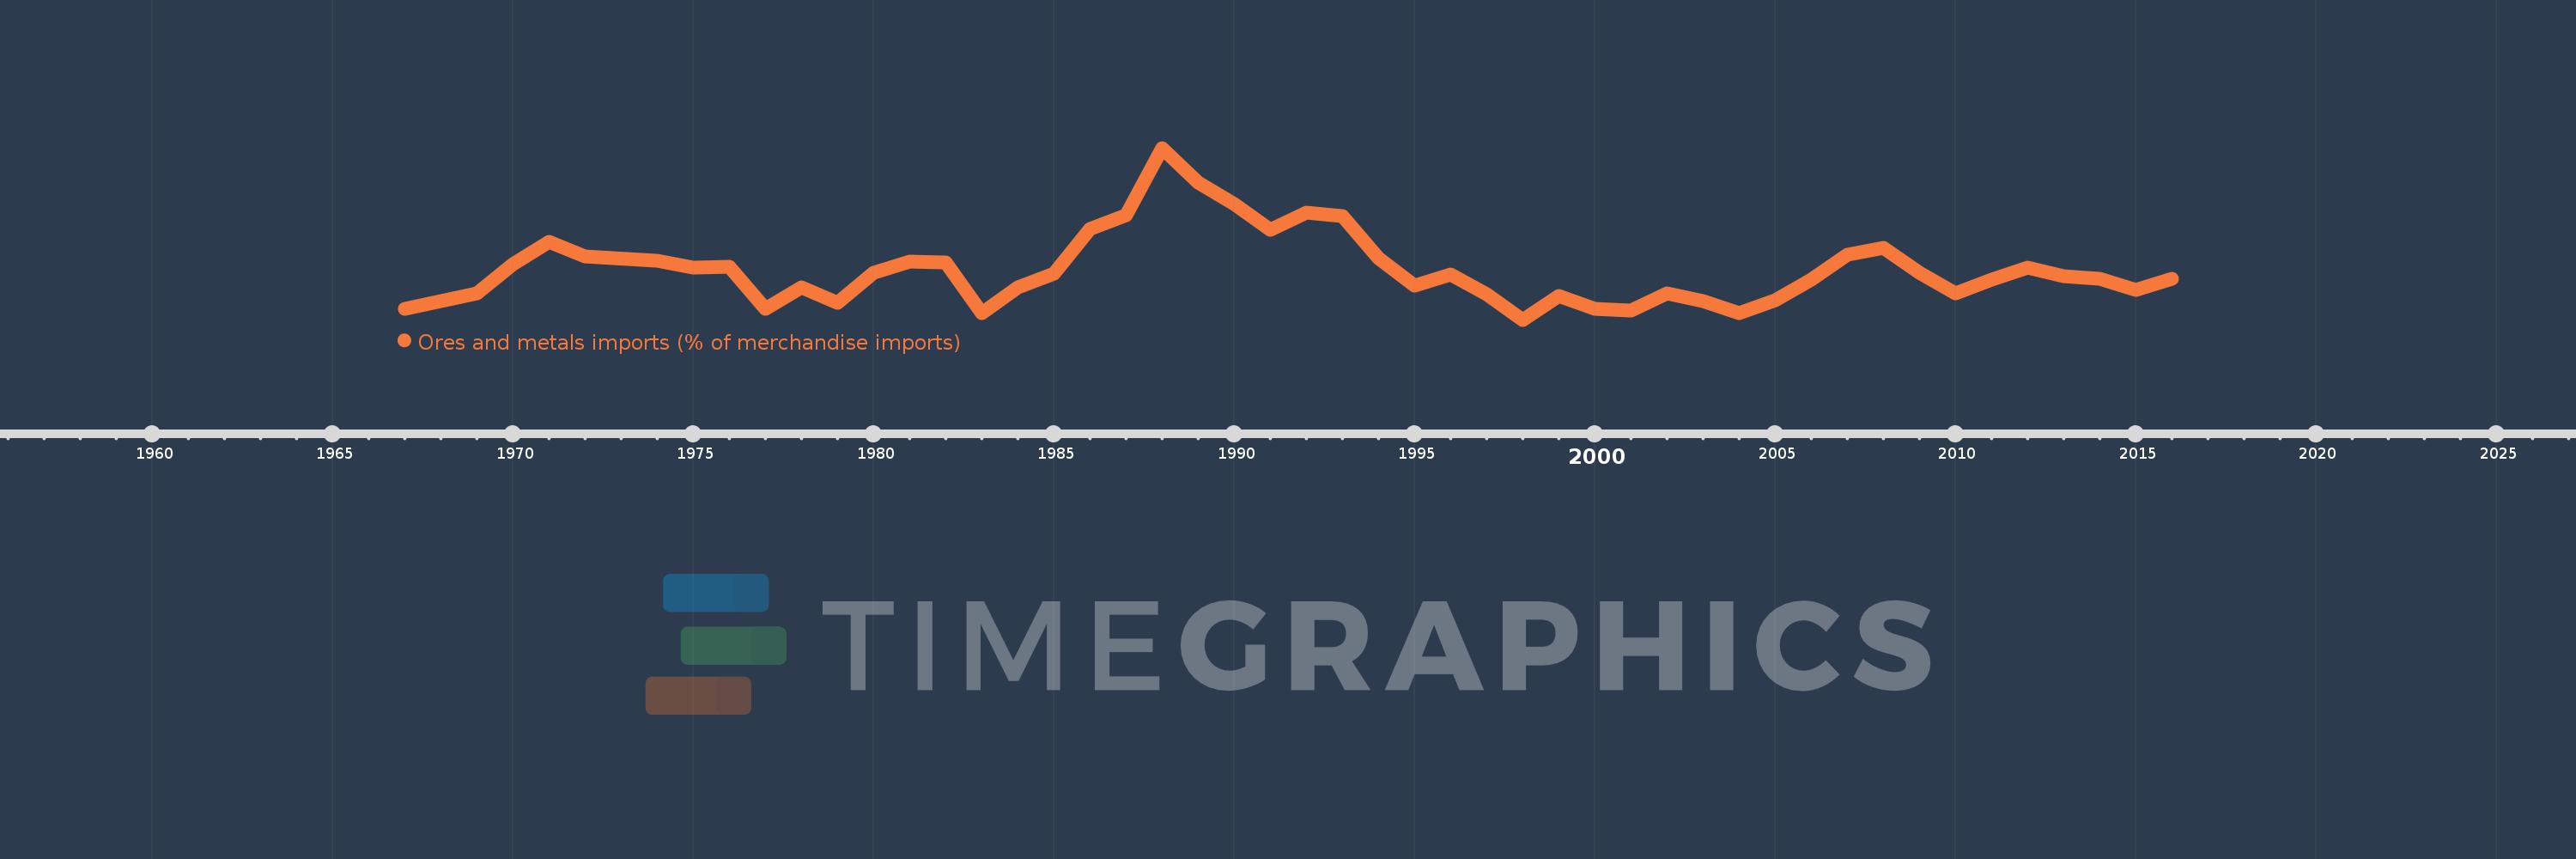
Ores and metals imports (% of merchandise imports)
2016,2015,2014,2013,2012,2011,2010,2009,2008,2007,2006,2005,2004,2003,2002,2001,2000,1999,1998,1997,1996,1995,1994,1993,1992,1991,1990,1989,1988,1987,1986,1985,1984,1983,1982,1981,1980,1979,1978,1977,1976,1975,1974,1972,1971,1970,1969,1967
This statistics in other country:
AfghanistanAlbaniaAlgeriaAndorraAngolaAntigua and BarbudaArab WorldArgentinaArmeniaArubaAustraliaAustriaAzerbaijanBahamas, TheBahrainBangladeshBarbadosBelarusBelgiumBelizeBeninBermudaBhutanBoliviaBosnia and HerzegovinaBotswanaBrazilBrunei DarussalamBulgariaBurkina FasoBurundiCabo VerdeCambodiaCameroonCanadaCaribbean small statesCayman IslandsCentral African RepublicCentral Europe and the BalticsChadChileChinaColombiaComorosCongo, Dem. Rep.Congo, Rep.Costa RicaCote d'IvoireCroatiaCubaCyprusCzech RepublicDenmarkDjiboutiDominicaDominican RepublicEarly-demographic dividendEast Asia & PacificEast Asia & Pacific (excluding high income)East Asia & Pacific (IDA & IBRD countries)EcuadorEgypt, Arab Rep.El SalvadorEquatorial GuineaEritreaEstoniaEthiopiaEuro areaEurope & Central AsiaEurope & Central Asia (excluding high income)Europe & Central Asia (IDA & IBRD countries)European UnionFaroe IslandsFijiFinlandFragile and conflict affected situationsFranceFrench PolynesiaGabonGambia, TheGeorgiaGermanyGhanaGreeceGreenlandGrenadaGuatemalaGuineaGuinea-BissauGuyanaHaitiHeavily indebted poor countries (HIPC)High incomeHondurasHong Kong SAR, ChinaHungaryIBRD onlyIcelandIDA & IBRD totalIDA blendIDA onlyIDA totalIndiaIndonesiaIran, Islamic Rep.IraqIrelandIsraelItalyJamaicaJapanJordanKazakhstanKenyaKiribatiKorea, Rep.KuwaitKyrgyz RepublicLao PDRLate-demographic dividendLatin America & Caribbean Latin America & Caribbean (excluding high income)Latin America & the Caribbean (IDA & IBRD countries)LatviaLeast developed countries: UN classificationLebanonLesothoLiberiaLibyaLithuaniaLow & middle incomeLow incomeLower middle incomeLuxembourgMacao SAR, ChinaMacedonia, FYRMadagascarMalawiMalaysiaMaldivesMaliMaltaMauritaniaMauritiusMexicoMiddle East & North AfricaMiddle East & North Africa (excluding high income)Middle East & North Africa (IDA & IBRD countries)Middle incomeMoldovaMongoliaMoroccoMozambiqueMyanmarNamibiaNepalNetherlandsNew CaledoniaNew ZealandNicaraguaNigerNigeriaNorth AmericaNorwayOECD membersOmanOther small statesPacific island small statesPakistanPalauPanamaPapua New GuineaParaguayPeruPhilippinesPolandPortugalPost-demographic dividendPre-demographic dividendQatarRomaniaRussian FederationRwandaSamoaSao Tome and PrincipeSaudi ArabiaSenegalSerbiaSeychellesSierra LeoneSingaporeSlovak RepublicSloveniaSmall statesSolomon IslandsSomaliaSouth AfricaSouth AsiaSouth Asia (IDA & IBRD)SpainSri LankaSt. Kitts and NevisSt. LuciaSt. Vincent and the GrenadinesSub-Saharan Africa Sub-Saharan Africa (excluding high income)Sub-Saharan Africa (IDA & IBRD countries)SudanSurinameSwazilandSwedenSwitzerlandSyrian Arab RepublicTajikistanTanzaniaThailandTimor-LesteTogoTongaTrinidad and TobagoTunisiaTurkeyTurkmenistanTurks and Caicos IslandsTuvaluUgandaUkraineUnited Arab EmiratesUnited KingdomUnited StatesUpper middle incomeUruguayVanuatuVenezuela, RBVietnamVirgin Islands (U.S.)WorldYemen, Rep.ZambiaZimbabwe Timeline:
This timeline shows a graph from 1967 to 2016 of Algeria. No data until 1966. Number of actual observations by date: 48.
Source name:
World Development Indicators
Source organization:
World Bank staff estimates from the Comtrade database maintained by the United Nations Statistics Division.
Categories, topics:
Energy & Mining, Private Sector, Trade
Last updated:
apr 23, 2017
Indicators value changes by year
At the date of observation
Value
Absolute change
Change from previous value
jan 1, 1967
1.22
+1.22
0.0%
jan 1, 1969
1.384
+0.164
13.44%
jan 1, 1970
1.686
+0.302
21.8%
jan 1, 1971
1.918
+0.233
13.8%
jan 1, 1972
1.767
-0.151
-7.87%
jan 1, 1974
1.727
-0.04
-2.26%
jan 1, 1975
1.655
-0.072
-4.16%
jan 1, 1976
1.662
+0.007
0.4%
jan 1, 1977
1.216
-0.446
-26.83%
jan 1, 1978
1.447
+0.23
18.95%
jan 1, 1979
1.278
-0.168
-11.64%
jan 1, 1980
1.593
+0.314
24.59%
jan 1, 1981
1.716
+0.124
7.76%
jan 1, 1982
1.708
-0.008
-0.47%
jan 1, 1983
1.171
-0.537
-31.47%
jan 1, 1984
1.444
+0.273
23.35%
jan 1, 1985
1.59
+0.146
10.13%
jan 1, 1986
2.058
+0.468
29.43%
jan 1, 1987
2.205
+0.147
7.13%
jan 1, 1988
2.906
+0.701
31.78%
jan 1, 1989
2.54
-0.365
-12.57%
jan 1, 1990
2.314
-0.227
-8.92%
jan 1, 1991
2.049
-0.265
-11.45%
jan 1, 1992
2.23
+0.181
8.84%
jan 1, 1993
2.192
-0.038
-1.7%
jan 1, 1994
1.747
-0.445
-20.29%
jan 1, 1995
1.466
-0.281
-16.1%
jan 1, 1996
1.578
+0.112
7.64%
jan 1, 1997
1.368
-0.21
-13.29%
jan 1, 1998
1.104
-0.264
-19.31%
jan 1, 1999
1.357
+0.253
22.88%
jan 1, 2000
1.214
-0.143
-10.55%
jan 1, 2001
1.198
-0.015
-1.28%
jan 1, 2002
1.384
+0.186
15.54%
jan 1, 2003
1.297
-0.088
-6.32%
jan 1, 2004
1.172
-0.125
-9.66%
jan 1, 2005
1.305
+0.134
11.4%
jan 1, 2006
1.526
+0.22
16.89%
jan 1, 2007
1.783
+0.258
16.91%
jan 1, 2008
1.856
+0.072
4.04%
jan 1, 2009
1.6
-0.255
-13.74%
jan 1, 2010
1.382
-0.219
-13.68%
jan 1, 2011
1.526
+0.145
10.48%
jan 1, 2012
1.649
+0.122
8.01%
jan 1, 2013
1.565
-0.084
-5.07%
jan 1, 2014
1.532
-0.033
-2.11%
jan 1, 2015
1.421
-0.111
-7.23%
jan 1, 2016
1.536
+0.115
8.12%
Ranking of countries by current statistics by years


Comments: