29
/
en
AIzaSyAYiBZKx7MnpbEhh9jyipgxe19OcubqV5w
April 1, 2024
95288
Burkina Faso
BFA
true
2
1
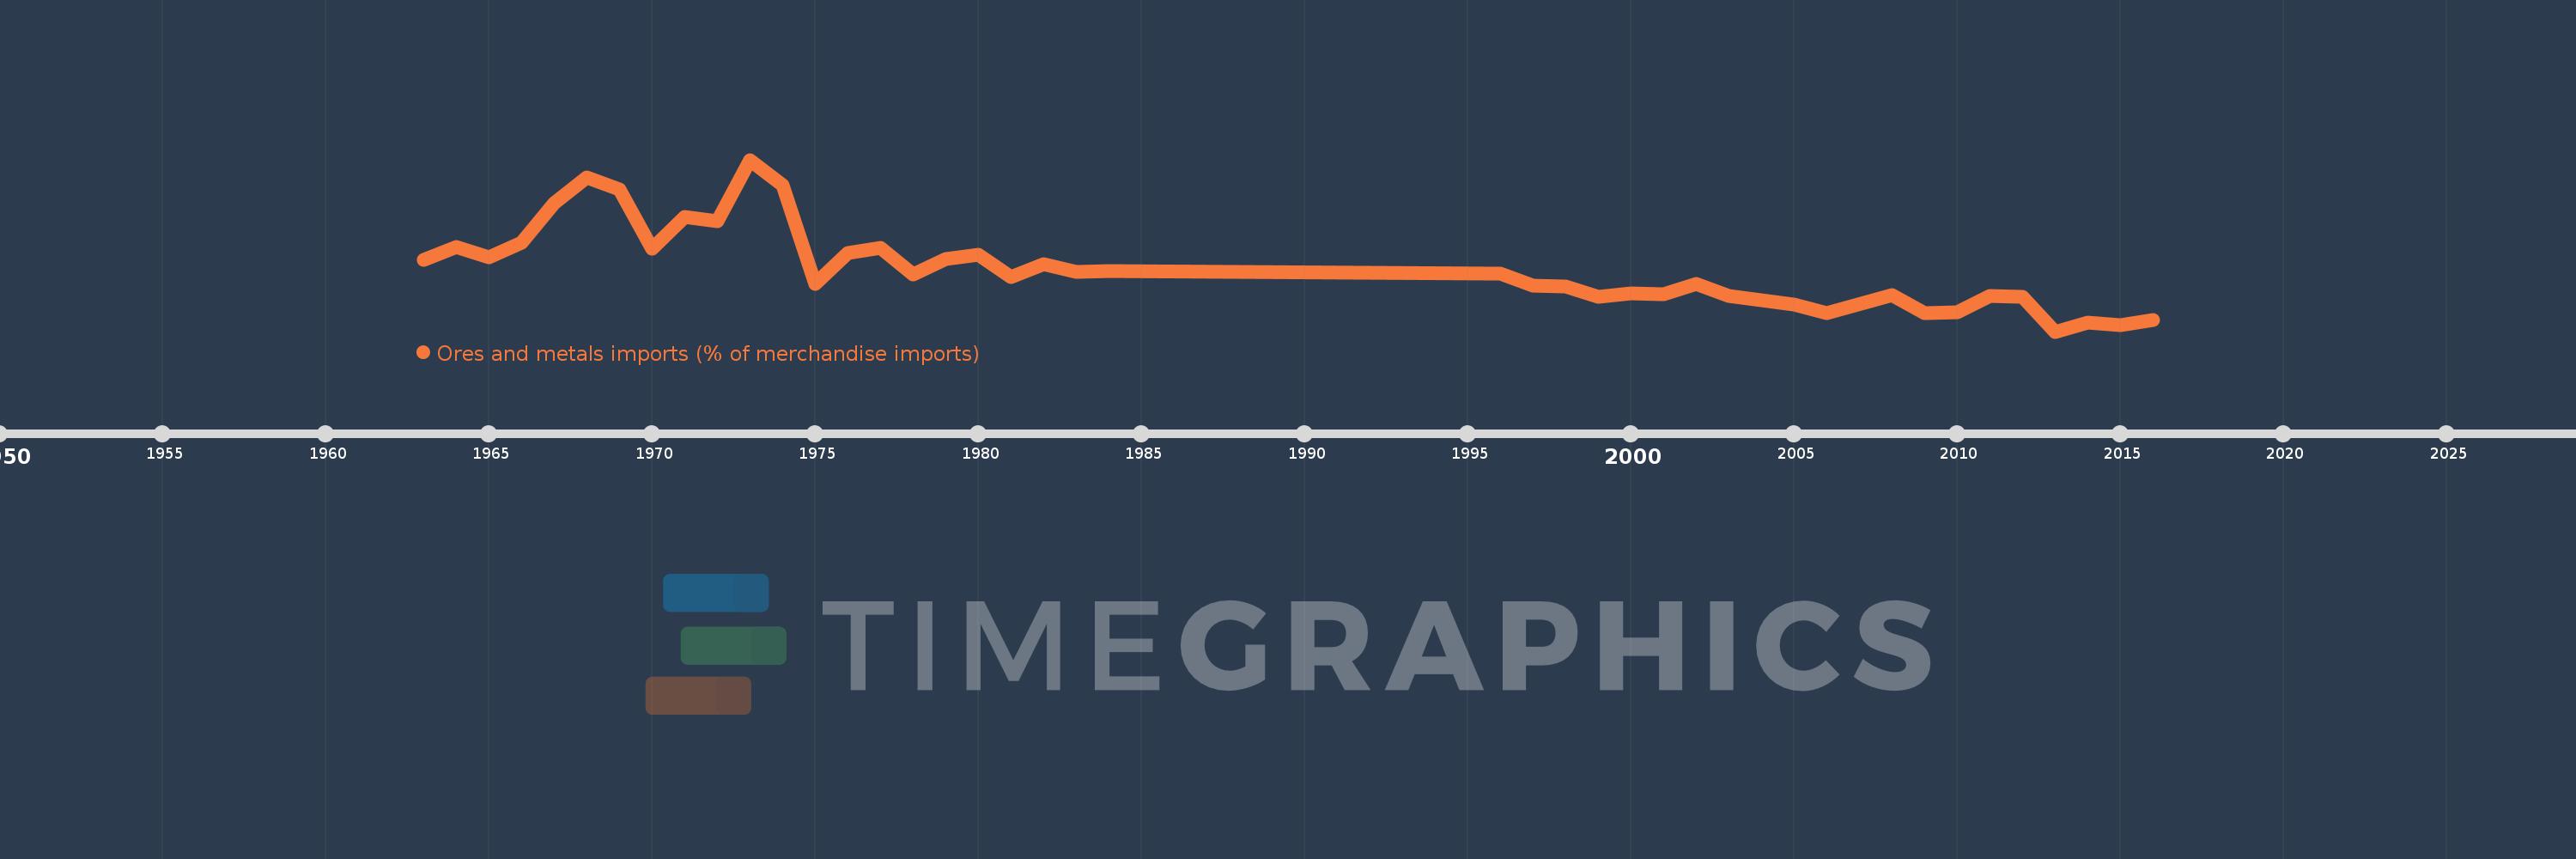
Ores and metals imports (% of merchandise imports)
2016,2015,2014,2013,2012,2011,2010,2009,2008,2006,2005,2004,2003,2002,2001,2000,1999,1998,1997,1996,1984,1983,1982,1981,1980,1979,1978,1977,1976,1975,1974,1973,1972,1971,1970,1969,1968,1967,1966,1965,1964,1963
This statistics in other country:
AfghanistanAlbaniaAlgeriaAndorraAngolaAntigua and BarbudaArab WorldArgentinaArmeniaArubaAustraliaAustriaAzerbaijanBahamas, TheBahrainBangladeshBarbadosBelarusBelgiumBelizeBeninBermudaBhutanBoliviaBosnia and HerzegovinaBotswanaBrazilBrunei DarussalamBulgariaBurkina FasoBurundiCabo VerdeCambodiaCameroonCanadaCaribbean small statesCayman IslandsCentral African RepublicCentral Europe and the BalticsChadChileChinaColombiaComorosCongo, Dem. Rep.Congo, Rep.Costa RicaCote d'IvoireCroatiaCubaCyprusCzech RepublicDenmarkDjiboutiDominicaDominican RepublicEarly-demographic dividendEast Asia & PacificEast Asia & Pacific (excluding high income)East Asia & Pacific (IDA & IBRD countries)EcuadorEgypt, Arab Rep.El SalvadorEquatorial GuineaEritreaEstoniaEthiopiaEuro areaEurope & Central AsiaEurope & Central Asia (excluding high income)Europe & Central Asia (IDA & IBRD countries)European UnionFaroe IslandsFijiFinlandFragile and conflict affected situationsFranceFrench PolynesiaGabonGambia, TheGeorgiaGermanyGhanaGreeceGreenlandGrenadaGuatemalaGuineaGuinea-BissauGuyanaHaitiHeavily indebted poor countries (HIPC)High incomeHondurasHong Kong SAR, ChinaHungaryIBRD onlyIcelandIDA & IBRD totalIDA blendIDA onlyIDA totalIndiaIndonesiaIran, Islamic Rep.IraqIrelandIsraelItalyJamaicaJapanJordanKazakhstanKenyaKiribatiKorea, Rep.KuwaitKyrgyz RepublicLao PDRLate-demographic dividendLatin America & Caribbean Latin America & Caribbean (excluding high income)Latin America & the Caribbean (IDA & IBRD countries)LatviaLeast developed countries: UN classificationLebanonLesothoLiberiaLibyaLithuaniaLow & middle incomeLow incomeLower middle incomeLuxembourgMacao SAR, ChinaMacedonia, FYRMadagascarMalawiMalaysiaMaldivesMaliMaltaMauritaniaMauritiusMexicoMiddle East & North AfricaMiddle East & North Africa (excluding high income)Middle East & North Africa (IDA & IBRD countries)Middle incomeMoldovaMongoliaMoroccoMozambiqueMyanmarNamibiaNepalNetherlandsNew CaledoniaNew ZealandNicaraguaNigerNigeriaNorth AmericaNorwayOECD membersOmanOther small statesPacific island small statesPakistanPalauPanamaPapua New GuineaParaguayPeruPhilippinesPolandPortugalPost-demographic dividendPre-demographic dividendQatarRomaniaRussian FederationRwandaSamoaSao Tome and PrincipeSaudi ArabiaSenegalSerbiaSeychellesSierra LeoneSingaporeSlovak RepublicSloveniaSmall statesSolomon IslandsSomaliaSouth AfricaSouth AsiaSouth Asia (IDA & IBRD)SpainSri LankaSt. Kitts and NevisSt. LuciaSt. Vincent and the GrenadinesSub-Saharan Africa Sub-Saharan Africa (excluding high income)Sub-Saharan Africa (IDA & IBRD countries)SudanSurinameSwazilandSwedenSwitzerlandSyrian Arab RepublicTajikistanTanzaniaThailandTimor-LesteTogoTongaTrinidad and TobagoTunisiaTurkeyTurkmenistanTurks and Caicos IslandsTuvaluUgandaUkraineUnited Arab EmiratesUnited KingdomUnited StatesUpper middle incomeUruguayVanuatuVenezuela, RBVietnamVirgin Islands (U.S.)WorldYemen, Rep.ZambiaZimbabwe Timeline:
This timeline shows a graph from 1963 to 2016 of Burkina Faso. No data until 1962. Number of actual observations by date: 42.
Source name:
World Development Indicators
Source organization:
World Bank staff estimates from the Comtrade database maintained by the United Nations Statistics Division.
Categories, topics:
Energy & Mining, Private Sector, Trade
Last updated:
apr 23, 2017
Indicators value changes by year
At the date of observation
Value
Absolute change
Change from previous value
jan 1, 1963
1.374
+1.374
0.0%
jan 1, 1964
1.543
+0.169
12.27%
jan 1, 1965
1.409
-0.133
-8.64%
jan 1, 1966
1.608
+0.199
14.11%
jan 1, 1967
2.146
+0.538
33.44%
jan 1, 1968
2.505
+0.359
16.74%
jan 1, 1969
2.339
-0.166
-6.64%
jan 1, 1970
1.525
-0.814
-34.79%
jan 1, 1971
1.953
+0.427
28.01%
jan 1, 1972
1.897
-0.056
-2.85%
jan 1, 1973
2.741
+0.844
44.49%
jan 1, 1974
2.398
-0.343
-12.52%
jan 1, 1975
1.042
-1.355
-56.53%
jan 1, 1976
1.459
+0.417
39.98%
jan 1, 1977
1.534
+0.075
5.11%
jan 1, 1978
1.165
-0.369
-24.06%
jan 1, 1979
1.378
+0.213
18.27%
jan 1, 1980
1.437
+0.059
4.29%
jan 1, 1981
1.138
-0.299
-20.79%
jan 1, 1982
1.311
+0.173
15.22%
jan 1, 1983
1.204
-0.108
-8.22%
jan 1, 1984
1.214
+0.01
0.83%
jan 1, 1996
1.181
-0.032
-2.66%
jan 1, 1997
1.016
-0.165
-14.0%
jan 1, 1998
1.009
-0.007
-0.73%
jan 1, 1999
0.869
-0.139
-13.82%
jan 1, 2000
0.913
+0.044
5.09%
jan 1, 2001
0.903
-0.01
-1.11%
jan 1, 2002
1.039
+0.136
15.07%
jan 1, 2003
0.878
-0.161
-15.54%
jan 1, 2004
0.814
-0.064
-7.32%
jan 1, 2005
0.762
-0.052
-6.4%
jan 1, 2006
0.642
-0.12
-15.76%
jan 1, 2008
0.885
+0.243
37.94%
jan 1, 2009
0.641
-0.244
-27.52%
jan 1, 2010
0.648
+0.006
1.0%
jan 1, 2011
0.879
+0.231
35.69%
jan 1, 2012
0.859
-0.02
-2.24%
jan 1, 2013
0.388
-0.472
-54.89%
jan 1, 2014
0.51
+0.122
31.52%
jan 1, 2015
0.482
-0.028
-5.46%
jan 1, 2016
0.55
+0.068
14.19%
Ranking of countries by current statistics by years


Comments: