29
/
en
AIzaSyAYiBZKx7MnpbEhh9jyipgxe19OcubqV5w
April 1, 2024
276980
United States
USA
true
2
1
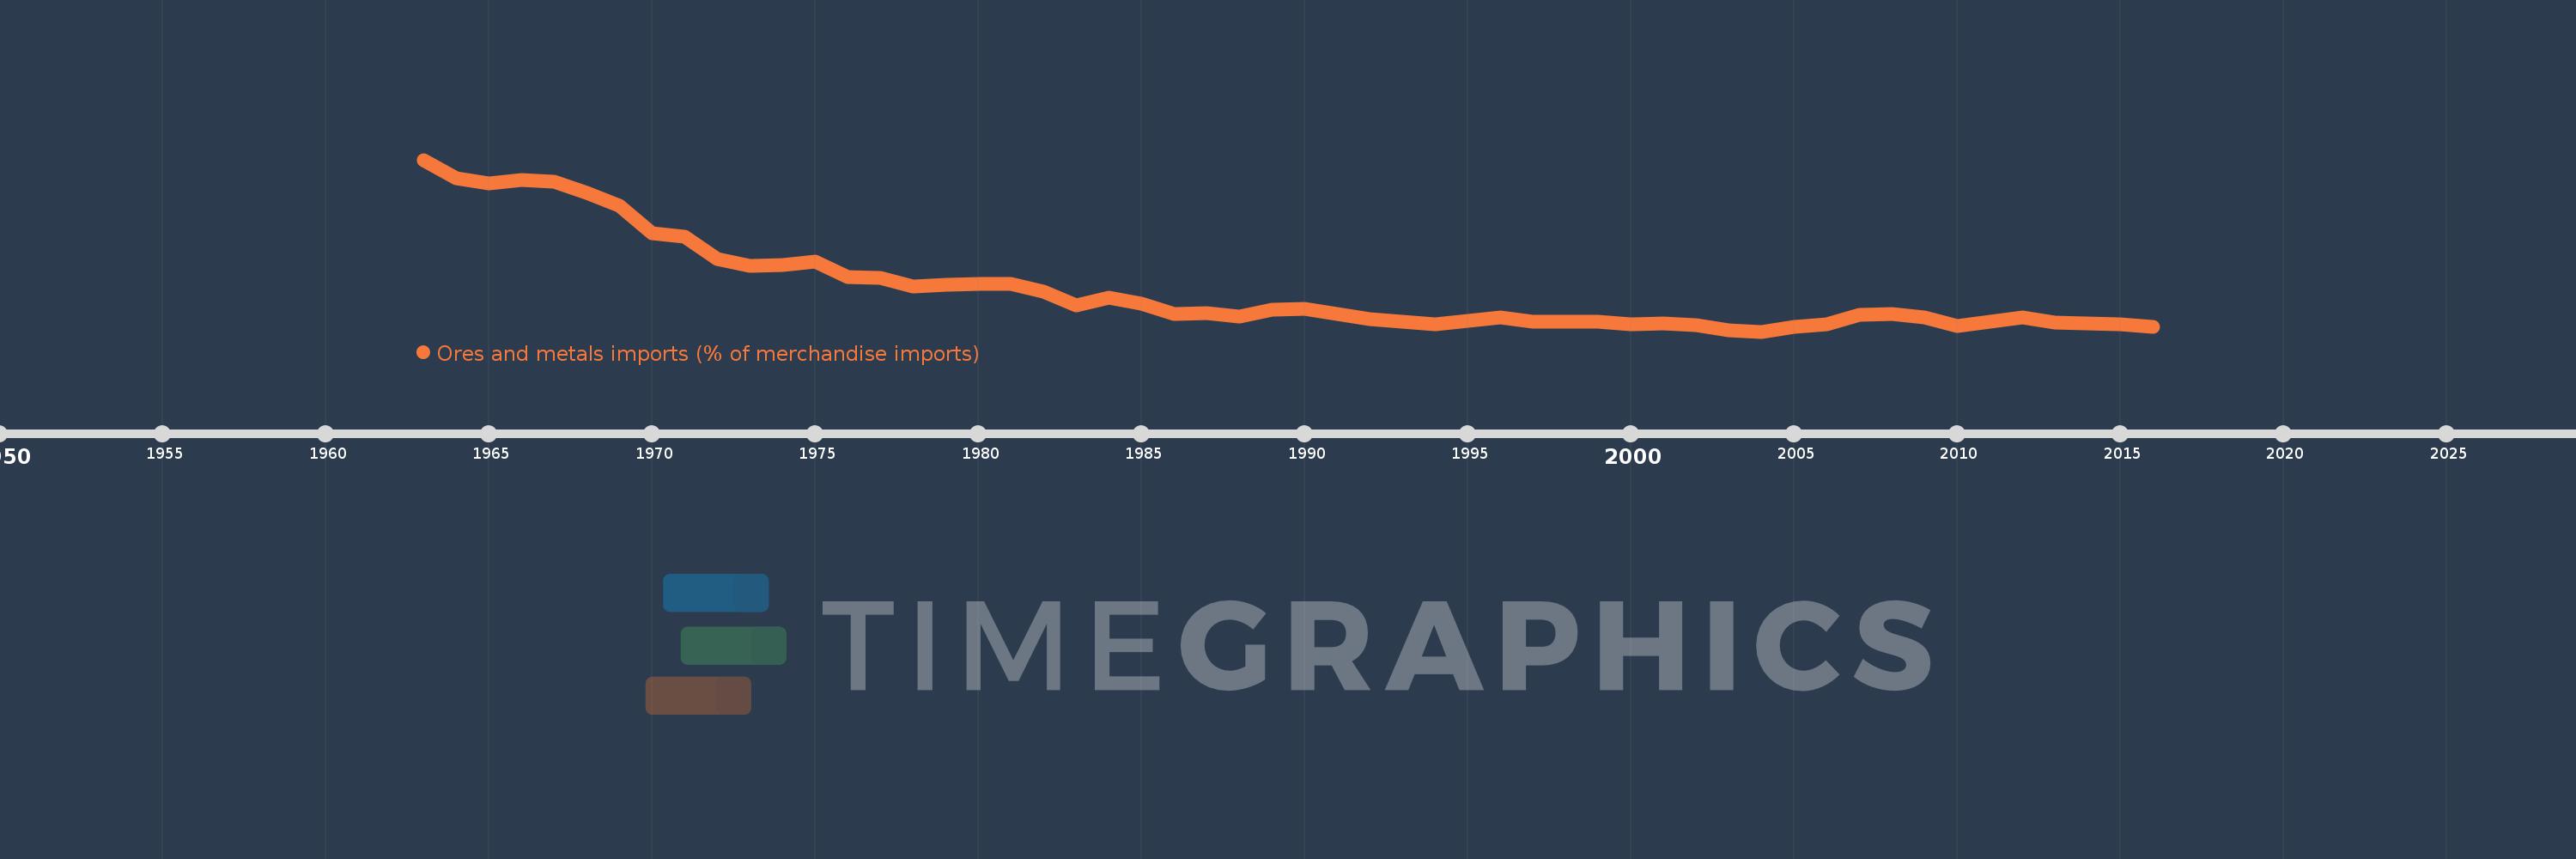
Ores and metals imports (% of merchandise imports)
2016,2015,2014,2013,2012,2011,2010,2009,2008,2007,2006,2005,2004,2003,2002,2001,2000,1999,1998,1997,1996,1995,1994,1993,1992,1991,1990,1989,1988,1987,1986,1985,1984,1983,1982,1981,1980,1979,1978,1977,1976,1975,1974,1973,1972,1971,1970,1969,1968,1967,1966,1965,1964,1963
This statistics in other country:
AfghanistanAlbaniaAlgeriaAndorraAngolaAntigua and BarbudaArab WorldArgentinaArmeniaArubaAustraliaAustriaAzerbaijanBahamas, TheBahrainBangladeshBarbadosBelarusBelgiumBelizeBeninBermudaBhutanBoliviaBosnia and HerzegovinaBotswanaBrazilBrunei DarussalamBulgariaBurkina FasoBurundiCabo VerdeCambodiaCameroonCanadaCaribbean small statesCayman IslandsCentral African RepublicCentral Europe and the BalticsChadChileChinaColombiaComorosCongo, Dem. Rep.Congo, Rep.Costa RicaCote d'IvoireCroatiaCubaCyprusCzech RepublicDenmarkDjiboutiDominicaDominican RepublicEarly-demographic dividendEast Asia & PacificEast Asia & Pacific (excluding high income)East Asia & Pacific (IDA & IBRD countries)EcuadorEgypt, Arab Rep.El SalvadorEquatorial GuineaEritreaEstoniaEthiopiaEuro areaEurope & Central AsiaEurope & Central Asia (excluding high income)Europe & Central Asia (IDA & IBRD countries)European UnionFaroe IslandsFijiFinlandFragile and conflict affected situationsFranceFrench PolynesiaGabonGambia, TheGeorgiaGermanyGhanaGreeceGreenlandGrenadaGuatemalaGuineaGuinea-BissauGuyanaHaitiHeavily indebted poor countries (HIPC)High incomeHondurasHong Kong SAR, ChinaHungaryIBRD onlyIcelandIDA & IBRD totalIDA blendIDA onlyIDA totalIndiaIndonesiaIran, Islamic Rep.IraqIrelandIsraelItalyJamaicaJapanJordanKazakhstanKenyaKiribatiKorea, Rep.KuwaitKyrgyz RepublicLao PDRLate-demographic dividendLatin America & Caribbean Latin America & Caribbean (excluding high income)Latin America & the Caribbean (IDA & IBRD countries)LatviaLeast developed countries: UN classificationLebanonLesothoLiberiaLibyaLithuaniaLow & middle incomeLow incomeLower middle incomeLuxembourgMacao SAR, ChinaMacedonia, FYRMadagascarMalawiMalaysiaMaldivesMaliMaltaMauritaniaMauritiusMexicoMiddle East & North AfricaMiddle East & North Africa (excluding high income)Middle East & North Africa (IDA & IBRD countries)Middle incomeMoldovaMongoliaMoroccoMozambiqueMyanmarNamibiaNepalNetherlandsNew CaledoniaNew ZealandNicaraguaNigerNigeriaNorth AmericaNorwayOECD membersOmanOther small statesPacific island small statesPakistanPalauPanamaPapua New GuineaParaguayPeruPhilippinesPolandPortugalPost-demographic dividendPre-demographic dividendQatarRomaniaRussian FederationRwandaSamoaSao Tome and PrincipeSaudi ArabiaSenegalSerbiaSeychellesSierra LeoneSingaporeSlovak RepublicSloveniaSmall statesSolomon IslandsSomaliaSouth AfricaSouth AsiaSouth Asia (IDA & IBRD)SpainSri LankaSt. Kitts and NevisSt. LuciaSt. Vincent and the GrenadinesSub-Saharan Africa Sub-Saharan Africa (excluding high income)Sub-Saharan Africa (IDA & IBRD countries)SudanSurinameSwazilandSwedenSwitzerlandSyrian Arab RepublicTajikistanTanzaniaThailandTimor-LesteTogoTongaTrinidad and TobagoTunisiaTurkeyTurkmenistanTurks and Caicos IslandsTuvaluUgandaUkraineUnited Arab EmiratesUnited KingdomUnited StatesUpper middle incomeUruguayVanuatuVenezuela, RBVietnamVirgin Islands (U.S.)WorldYemen, Rep.ZambiaZimbabwe Timeline:
This timeline shows a graph from 1963 to 2016 of United States. No data until 1962. Number of actual observations by date: 54.
Source name:
World Development Indicators
Source organization:
World Bank staff estimates from the Comtrade database maintained by the United Nations Statistics Division.
Categories, topics:
Energy & Mining, Private Sector, Trade
Last updated:
apr 23, 2017
Indicators value changes by year
Maximum:
12.585
jan 1, 1963
At the date of observation
Value
Absolute change
Change from previous value
jan 1, 1963
12.585
+12.585
0.0%
jan 1, 1964
11.435
-1.15
-9.14%
jan 1, 1965
11.101
-0.334
-2.92%
jan 1, 1966
11.301
+0.199
1.8%
jan 1, 1967
11.172
-0.129
-1.14%
jan 1, 1968
10.463
-0.709
-6.34%
jan 1, 1969
9.668
-0.796
-7.6%
jan 1, 1970
7.898
-1.77
-18.31%
jan 1, 1971
7.714
-0.183
-2.32%
jan 1, 1972
6.302
-1.413
-18.31%
jan 1, 1973
5.849
-0.453
-7.18%
jan 1, 1974
5.932
+0.083
1.41%
jan 1, 1975
6.149
+0.217
3.66%
jan 1, 1976
5.146
-1.003
-16.31%
jan 1, 1977
5.096
-0.05
-0.96%
jan 1, 1978
4.526
-0.57
-11.18%
jan 1, 1979
4.665
+0.138
3.06%
jan 1, 1980
4.687
+0.022
0.47%
jan 1, 1981
4.725
+0.039
0.82%
jan 1, 1982
4.232
-0.494
-10.45%
jan 1, 1983
3.349
-0.883
-20.86%
jan 1, 1984
3.841
+0.492
14.7%
jan 1, 1985
3.439
-0.401
-10.45%
jan 1, 1986
2.811
-0.628
-18.26%
jan 1, 1987
2.853
+0.041
1.46%
jan 1, 1988
2.626
-0.226
-7.94%
jan 1, 1989
3.09
+0.464
17.67%
jan 1, 1990
3.149
+0.059
1.91%
jan 1, 1991
2.818
-0.331
-10.52%
jan 1, 1992
2.489
-0.329
-11.68%
jan 1, 1993
2.294
-0.195
-7.83%
jan 1, 1994
2.13
-0.163
-7.12%
jan 1, 1995
2.349
+0.219
10.27%
jan 1, 1996
2.582
+0.233
9.92%
jan 1, 1997
2.324
-0.259
-10.01%
jan 1, 1998
2.33
+0.006
0.26%
jan 1, 1999
2.318
-0.012
-0.51%
jan 1, 2000
2.129
-0.189
-8.16%
jan 1, 2001
2.178
+0.049
2.32%
jan 1, 2002
2.094
-0.084
-3.86%
jan 1, 2003
1.792
-0.302
-14.44%
jan 1, 2004
1.683
-0.108
-6.04%
jan 1, 2005
2.004
+0.321
19.04%
jan 1, 2006
2.167
+0.163
8.12%
jan 1, 2007
2.761
+0.594
27.42%
jan 1, 2008
2.804
+0.043
1.55%
jan 1, 2009
2.595
-0.209
-7.46%
jan 1, 2010
2.021
-0.574
-22.11%
jan 1, 2011
2.32
+0.299
14.8%
jan 1, 2012
2.606
+0.286
12.33%
jan 1, 2013
2.273
-0.333
-12.79%
jan 1, 2014
2.18
-0.093
-4.08%
jan 1, 2015
2.149
-0.031
-1.41%
jan 1, 2016
1.977
-0.173
-8.04%
Ranking of countries by current statistics by years


Comments: