29
/
en
AIzaSyAYiBZKx7MnpbEhh9jyipgxe19OcubqV5w
April 1, 2024
52129
North America
NAC
false
2
1
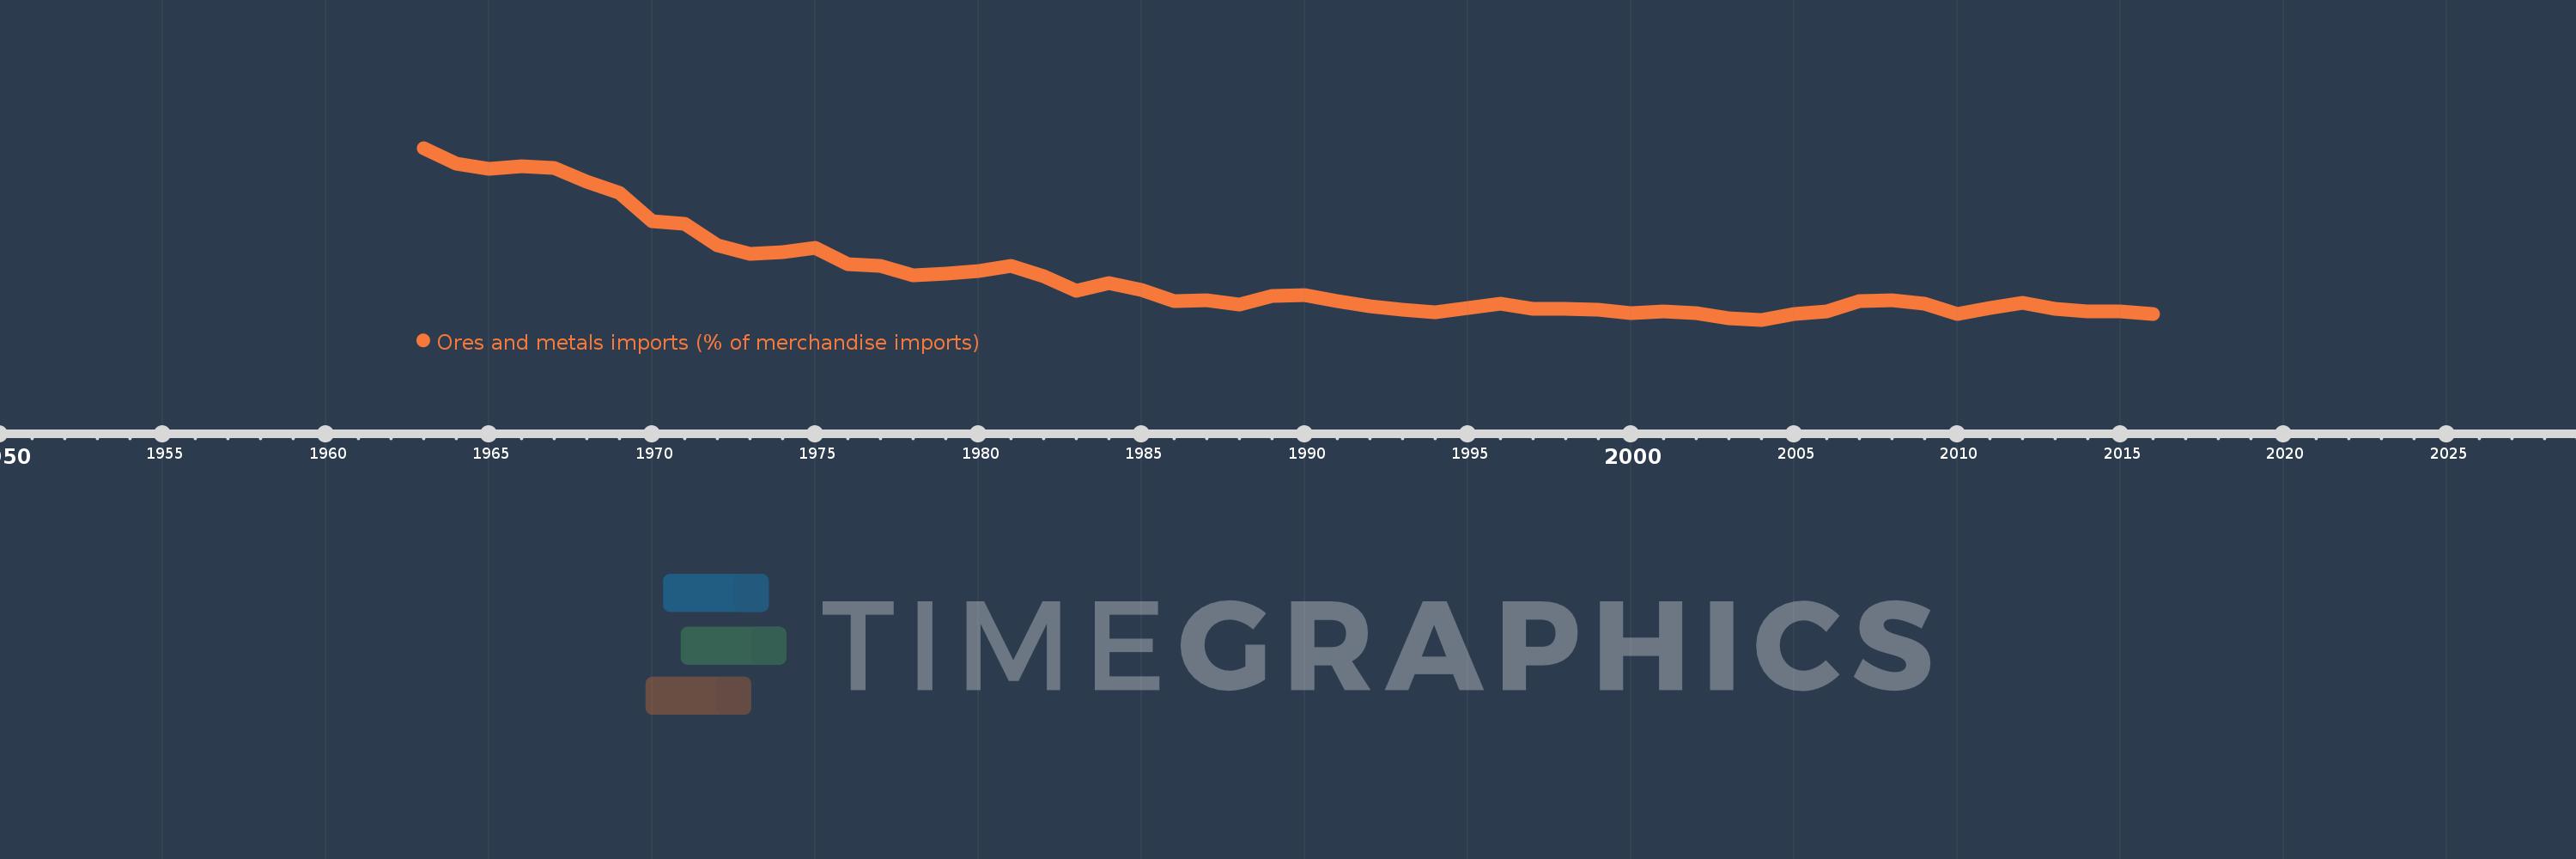
Ores and metals imports (% of merchandise imports)
2016,2015,2014,2013,2012,2011,2010,2009,2008,2007,2006,2005,2004,2003,2002,2001,2000,1999,1998,1997,1996,1995,1994,1993,1992,1991,1990,1989,1988,1987,1986,1985,1984,1983,1982,1981,1980,1979,1978,1977,1976,1975,1974,1973,1972,1971,1970,1969,1968,1967,1966,1965,1964,1963
This statistics in other country:
AfghanistanAlbaniaAlgeriaAndorraAngolaAntigua and BarbudaArab WorldArgentinaArmeniaArubaAustraliaAustriaAzerbaijanBahamas, TheBahrainBangladeshBarbadosBelarusBelgiumBelizeBeninBermudaBhutanBoliviaBosnia and HerzegovinaBotswanaBrazilBrunei DarussalamBulgariaBurkina FasoBurundiCabo VerdeCambodiaCameroonCanadaCaribbean small statesCayman IslandsCentral African RepublicCentral Europe and the BalticsChadChileChinaColombiaComorosCongo, Dem. Rep.Congo, Rep.Costa RicaCote d'IvoireCroatiaCubaCyprusCzech RepublicDenmarkDjiboutiDominicaDominican RepublicEarly-demographic dividendEast Asia & PacificEast Asia & Pacific (excluding high income)East Asia & Pacific (IDA & IBRD countries)EcuadorEgypt, Arab Rep.El SalvadorEquatorial GuineaEritreaEstoniaEthiopiaEuro areaEurope & Central AsiaEurope & Central Asia (excluding high income)Europe & Central Asia (IDA & IBRD countries)European UnionFaroe IslandsFijiFinlandFragile and conflict affected situationsFranceFrench PolynesiaGabonGambia, TheGeorgiaGermanyGhanaGreeceGreenlandGrenadaGuatemalaGuineaGuinea-BissauGuyanaHaitiHeavily indebted poor countries (HIPC)High incomeHondurasHong Kong SAR, ChinaHungaryIBRD onlyIcelandIDA & IBRD totalIDA blendIDA onlyIDA totalIndiaIndonesiaIran, Islamic Rep.IraqIrelandIsraelItalyJamaicaJapanJordanKazakhstanKenyaKiribatiKorea, Rep.KuwaitKyrgyz RepublicLao PDRLate-demographic dividendLatin America & Caribbean Latin America & Caribbean (excluding high income)Latin America & the Caribbean (IDA & IBRD countries)LatviaLeast developed countries: UN classificationLebanonLesothoLiberiaLibyaLithuaniaLow & middle incomeLow incomeLower middle incomeLuxembourgMacao SAR, ChinaMacedonia, FYRMadagascarMalawiMalaysiaMaldivesMaliMaltaMauritaniaMauritiusMexicoMiddle East & North AfricaMiddle East & North Africa (excluding high income)Middle East & North Africa (IDA & IBRD countries)Middle incomeMoldovaMongoliaMoroccoMozambiqueMyanmarNamibiaNepalNetherlandsNew CaledoniaNew ZealandNicaraguaNigerNigeriaNorth AmericaNorwayOECD membersOmanOther small statesPacific island small statesPakistanPalauPanamaPapua New GuineaParaguayPeruPhilippinesPolandPortugalPost-demographic dividendPre-demographic dividendQatarRomaniaRussian FederationRwandaSamoaSao Tome and PrincipeSaudi ArabiaSenegalSerbiaSeychellesSierra LeoneSingaporeSlovak RepublicSloveniaSmall statesSolomon IslandsSomaliaSouth AfricaSouth AsiaSouth Asia (IDA & IBRD)SpainSri LankaSt. Kitts and NevisSt. LuciaSt. Vincent and the GrenadinesSub-Saharan Africa Sub-Saharan Africa (excluding high income)Sub-Saharan Africa (IDA & IBRD countries)SudanSurinameSwazilandSwedenSwitzerlandSyrian Arab RepublicTajikistanTanzaniaThailandTimor-LesteTogoTongaTrinidad and TobagoTunisiaTurkeyTurkmenistanTurks and Caicos IslandsTuvaluUgandaUkraineUnited Arab EmiratesUnited KingdomUnited StatesUpper middle incomeUruguayVanuatuVenezuela, RBVietnamVirgin Islands (U.S.)WorldYemen, Rep.ZambiaZimbabwe Timeline:
This timeline shows a graph from 1963 to 2016 of North America. No data until 1962. Number of actual observations by date: 54.
Source name:
World Development Indicators
Source organization:
World Bank staff estimates from the Comtrade database maintained by the United Nations Statistics Division.
Categories, topics:
Energy & Mining, Private Sector, Trade
Last updated:
apr 23, 2017
Indicators value changes by year
Maximum:
11.219
jan 1, 1963
At the date of observation
Value
Absolute change
Change from previous value
jan 1, 1963
11.219
+11.219
0.0%
jan 1, 1964
10.337
-0.882
-7.86%
jan 1, 1965
10.076
-0.262
-2.53%
jan 1, 1966
10.234
+0.158
1.57%
jan 1, 1967
10.136
-0.097
-0.95%
jan 1, 1968
9.379
-0.758
-7.48%
jan 1, 1969
8.752
-0.627
-6.68%
jan 1, 1970
7.193
-1.559
-17.81%
jan 1, 1971
7.057
-0.136
-1.89%
jan 1, 1972
5.845
-1.212
-17.18%
jan 1, 1973
5.402
-0.443
-7.58%
jan 1, 1974
5.504
+0.102
1.89%
jan 1, 1975
5.711
+0.206
3.75%
jan 1, 1976
4.802
-0.909
-15.92%
jan 1, 1977
4.706
-0.096
-2.0%
jan 1, 1978
4.196
-0.509
-10.83%
jan 1, 1979
4.32
+0.124
2.96%
jan 1, 1980
4.458
+0.137
3.18%
jan 1, 1981
4.737
+0.279
6.25%
jan 1, 1982
4.158
-0.579
-12.22%
jan 1, 1983
3.371
-0.786
-18.91%
jan 1, 1984
3.787
+0.415
12.32%
jan 1, 1985
3.399
-0.388
-10.23%
jan 1, 1986
2.81
-0.589
-17.32%
jan 1, 1987
2.847
+0.037
1.32%
jan 1, 1988
2.616
-0.231
-8.12%
jan 1, 1989
3.055
+0.439
16.78%
jan 1, 1990
3.136
+0.08
2.62%
jan 1, 1991
2.808
-0.327
-10.43%
jan 1, 1992
2.486
-0.322
-11.47%
jan 1, 1993
2.333
-0.153
-6.15%
jan 1, 1994
2.171
-0.162
-6.93%
jan 1, 1995
2.392
+0.221
10.17%
jan 1, 1996
2.647
+0.255
10.66%
jan 1, 1997
2.384
-0.263
-9.95%
jan 1, 1998
2.368
-0.016
-0.66%
jan 1, 1999
2.324
-0.044
-1.84%
jan 1, 2000
2.143
-0.182
-7.82%
jan 1, 2001
2.201
+0.059
2.74%
jan 1, 2002
2.116
-0.086
-3.9%
jan 1, 2003
1.857
-0.259
-12.23%
jan 1, 2004
1.762
-0.095
-5.09%
jan 1, 2005
2.098
+0.336
19.04%
jan 1, 2006
2.226
+0.128
6.1%
jan 1, 2007
2.786
+0.56
25.17%
jan 1, 2008
2.832
+0.046
1.67%
jan 1, 2009
2.642
-0.191
-6.74%
jan 1, 2010
2.068
-0.574
-21.73%
jan 1, 2011
2.402
+0.334
16.17%
jan 1, 2012
2.709
+0.307
12.8%
jan 1, 2013
2.349
-0.361
-13.31%
jan 1, 2014
2.239
-0.11
-4.67%
jan 1, 2015
2.238
-0.001
-0.04%
jan 1, 2016
2.097
-0.141
-6.31%
Ranking of countries by current statistics by years


Comments: