29
/
en
AIzaSyAYiBZKx7MnpbEhh9jyipgxe19OcubqV5w
April 1, 2024
162997
Jamaica
JAM
true
2
1
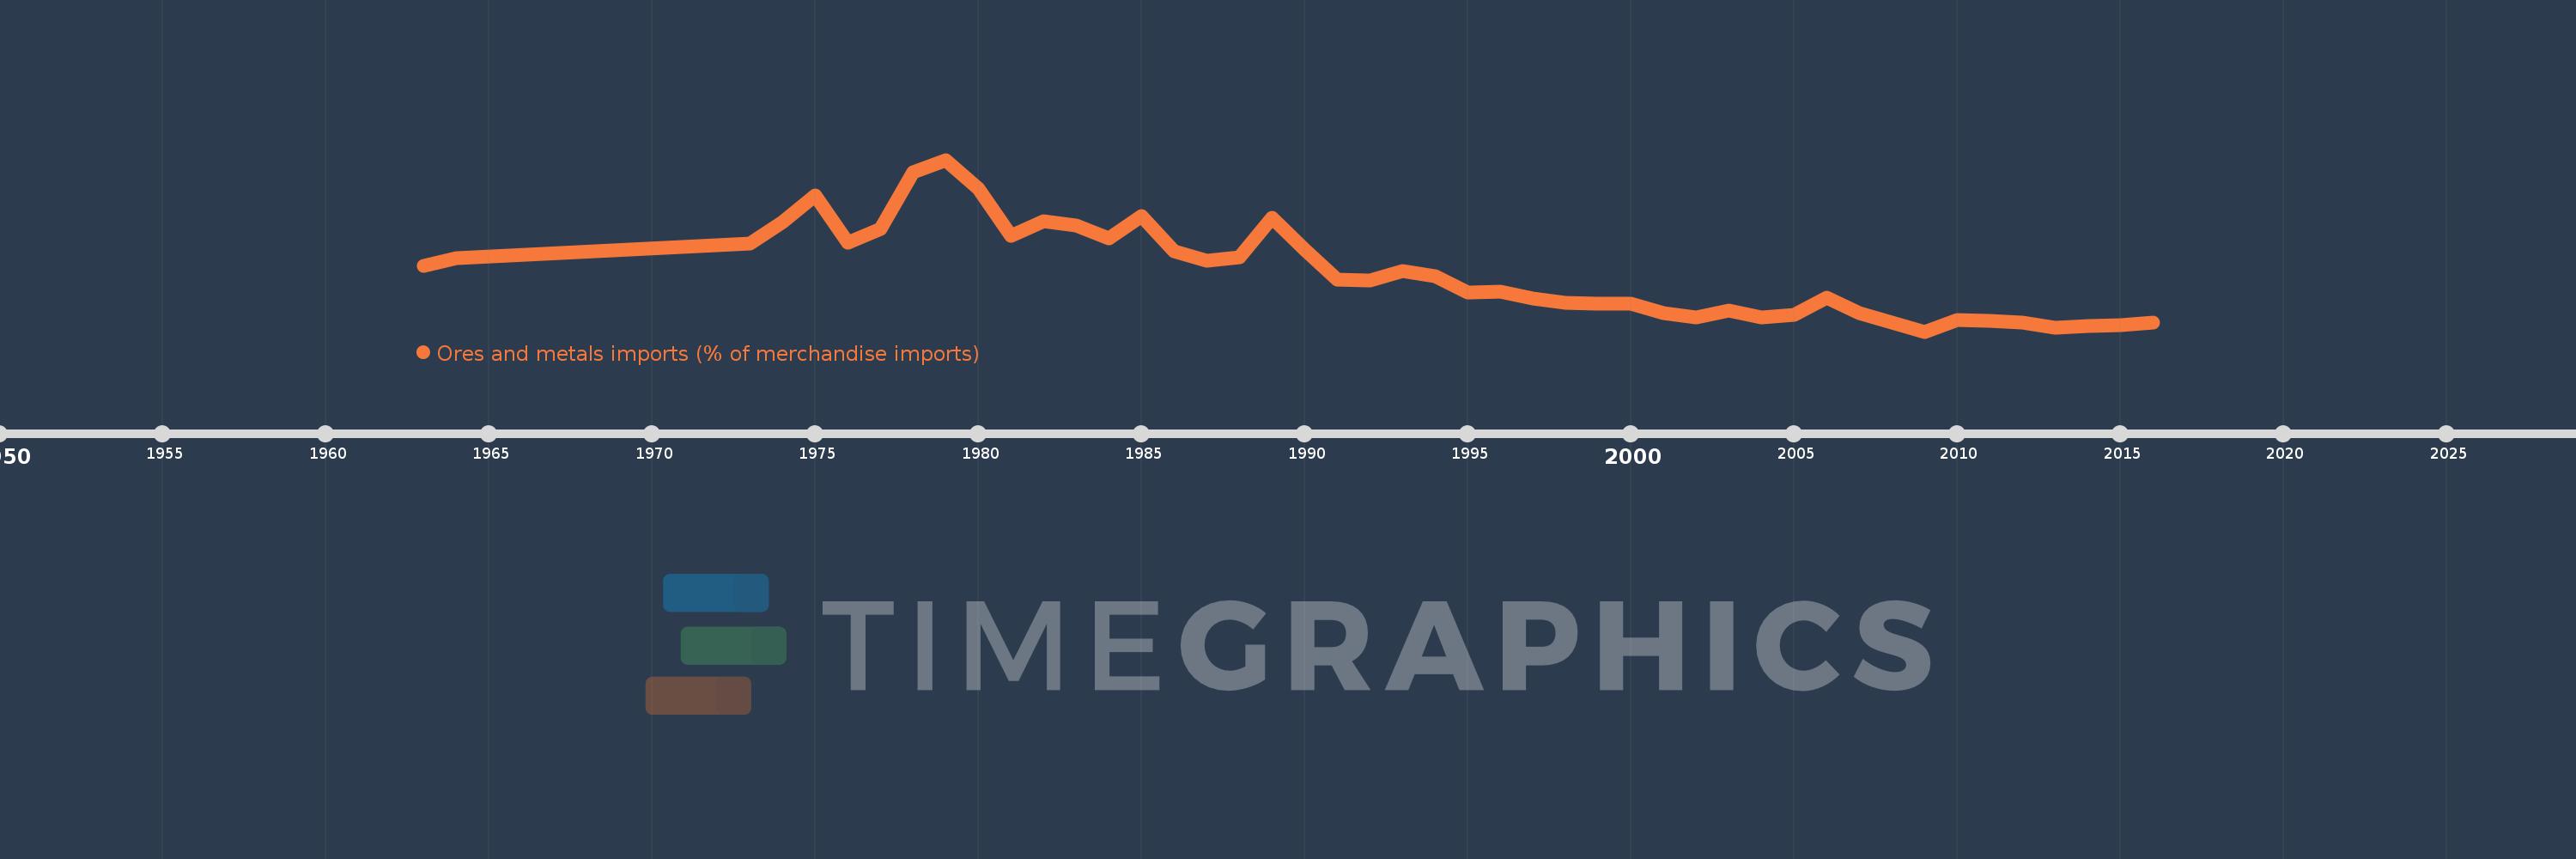
Ores and metals imports (% of merchandise imports)
2016,2015,2014,2013,2012,2011,2010,2009,2008,2007,2006,2005,2004,2003,2002,2001,2000,1999,1998,1997,1996,1995,1994,1993,1992,1991,1990,1989,1988,1987,1986,1985,1984,1983,1982,1981,1980,1979,1978,1977,1976,1975,1974,1973,1964,1963
This statistics in other country:
AfghanistanAlbaniaAlgeriaAndorraAngolaAntigua and BarbudaArab WorldArgentinaArmeniaArubaAustraliaAustriaAzerbaijanBahamas, TheBahrainBangladeshBarbadosBelarusBelgiumBelizeBeninBermudaBhutanBoliviaBosnia and HerzegovinaBotswanaBrazilBrunei DarussalamBulgariaBurkina FasoBurundiCabo VerdeCambodiaCameroonCanadaCaribbean small statesCayman IslandsCentral African RepublicCentral Europe and the BalticsChadChileChinaColombiaComorosCongo, Dem. Rep.Congo, Rep.Costa RicaCote d'IvoireCroatiaCubaCyprusCzech RepublicDenmarkDjiboutiDominicaDominican RepublicEarly-demographic dividendEast Asia & PacificEast Asia & Pacific (excluding high income)East Asia & Pacific (IDA & IBRD countries)EcuadorEgypt, Arab Rep.El SalvadorEquatorial GuineaEritreaEstoniaEthiopiaEuro areaEurope & Central AsiaEurope & Central Asia (excluding high income)Europe & Central Asia (IDA & IBRD countries)European UnionFaroe IslandsFijiFinlandFragile and conflict affected situationsFranceFrench PolynesiaGabonGambia, TheGeorgiaGermanyGhanaGreeceGreenlandGrenadaGuatemalaGuineaGuinea-BissauGuyanaHaitiHeavily indebted poor countries (HIPC)High incomeHondurasHong Kong SAR, ChinaHungaryIBRD onlyIcelandIDA & IBRD totalIDA blendIDA onlyIDA totalIndiaIndonesiaIran, Islamic Rep.IraqIrelandIsraelItalyJamaicaJapanJordanKazakhstanKenyaKiribatiKorea, Rep.KuwaitKyrgyz RepublicLao PDRLate-demographic dividendLatin America & Caribbean Latin America & Caribbean (excluding high income)Latin America & the Caribbean (IDA & IBRD countries)LatviaLeast developed countries: UN classificationLebanonLesothoLiberiaLibyaLithuaniaLow & middle incomeLow incomeLower middle incomeLuxembourgMacao SAR, ChinaMacedonia, FYRMadagascarMalawiMalaysiaMaldivesMaliMaltaMauritaniaMauritiusMexicoMiddle East & North AfricaMiddle East & North Africa (excluding high income)Middle East & North Africa (IDA & IBRD countries)Middle incomeMoldovaMongoliaMoroccoMozambiqueMyanmarNamibiaNepalNetherlandsNew CaledoniaNew ZealandNicaraguaNigerNigeriaNorth AmericaNorwayOECD membersOmanOther small statesPacific island small statesPakistanPalauPanamaPapua New GuineaParaguayPeruPhilippinesPolandPortugalPost-demographic dividendPre-demographic dividendQatarRomaniaRussian FederationRwandaSamoaSao Tome and PrincipeSaudi ArabiaSenegalSerbiaSeychellesSierra LeoneSingaporeSlovak RepublicSloveniaSmall statesSolomon IslandsSomaliaSouth AfricaSouth AsiaSouth Asia (IDA & IBRD)SpainSri LankaSt. Kitts and NevisSt. LuciaSt. Vincent and the GrenadinesSub-Saharan Africa Sub-Saharan Africa (excluding high income)Sub-Saharan Africa (IDA & IBRD countries)SudanSurinameSwazilandSwedenSwitzerlandSyrian Arab RepublicTajikistanTanzaniaThailandTimor-LesteTogoTongaTrinidad and TobagoTunisiaTurkeyTurkmenistanTurks and Caicos IslandsTuvaluUgandaUkraineUnited Arab EmiratesUnited KingdomUnited StatesUpper middle incomeUruguayVanuatuVenezuela, RBVietnamVirgin Islands (U.S.)WorldYemen, Rep.ZambiaZimbabwe Timeline:
This timeline shows a graph from 1963 to 2016 of Jamaica. No data until 1962. Number of actual observations by date: 46.
Source name:
World Development Indicators
Source organization:
World Bank staff estimates from the Comtrade database maintained by the United Nations Statistics Division.
Categories, topics:
Energy & Mining, Private Sector, Trade
Last updated:
apr 23, 2017
Indicators value changes by year
At the date of observation
Value
Absolute change
Change from previous value
jan 1, 1963
1.246
+1.246
0.0%
jan 1, 1964
1.352
+0.106
8.5%
jan 1, 1973
1.569
+0.217
16.09%
jan 1, 1974
1.883
+0.313
19.96%
jan 1, 1975
2.267
+0.384
20.41%
jan 1, 1976
1.583
-0.684
-30.17%
jan 1, 1977
1.784
+0.201
12.73%
jan 1, 1978
2.602
+0.818
45.84%
jan 1, 1979
2.781
+0.179
6.87%
jan 1, 1980
2.361
-0.42
-15.1%
jan 1, 1981
1.678
-0.684
-28.95%
jan 1, 1982
1.888
+0.21
12.52%
jan 1, 1983
1.823
-0.065
-3.45%
jan 1, 1984
1.64
-0.182
-10.01%
jan 1, 1985
1.967
+0.327
19.95%
jan 1, 1986
1.46
-0.507
-25.78%
jan 1, 1987
1.321
-0.139
-9.5%
jan 1, 1988
1.374
+0.053
4.0%
jan 1, 1989
1.947
+0.572
41.65%
jan 1, 1990
1.475
-0.471
-24.22%
jan 1, 1991
1.039
-0.436
-29.57%
jan 1, 1992
1.028
-0.011
-1.08%
jan 1, 1993
1.174
+0.146
14.22%
jan 1, 1994
1.096
-0.078
-6.64%
jan 1, 1995
0.861
-0.234
-21.39%
jan 1, 1996
0.869
+0.008
0.9%
jan 1, 1997
0.775
-0.094
-10.87%
jan 1, 1998
0.71
-0.065
-8.35%
jan 1, 1999
0.701
-0.009
-1.22%
jan 1, 2000
0.695
-0.006
-0.89%
jan 1, 2001
0.558
-0.137
-19.76%
jan 1, 2002
0.501
-0.056
-10.09%
jan 1, 2003
0.593
+0.091
18.19%
jan 1, 2004
0.497
-0.096
-16.16%
jan 1, 2005
0.533
+0.036
7.19%
jan 1, 2006
0.78
+0.248
46.53%
jan 1, 2007
0.555
-0.226
-28.9%
jan 1, 2008
0.417
-0.137
-24.78%
jan 1, 2009
0.292
-0.125
-29.96%
jan 1, 2010
0.458
+0.166
56.77%
jan 1, 2011
0.453
-0.005
-1.07%
jan 1, 2012
0.418
-0.036
-7.91%
jan 1, 2013
0.345
-0.073
-17.39%
jan 1, 2014
0.377
+0.032
9.21%
jan 1, 2015
0.383
+0.006
1.56%
jan 1, 2016
0.423
+0.04
10.55%
Ranking of countries by current statistics by years


Comments: