29
/
en
AIzaSyAYiBZKx7MnpbEhh9jyipgxe19OcubqV5w
April 1, 2024
262705
Thailand
THA
true
2
1
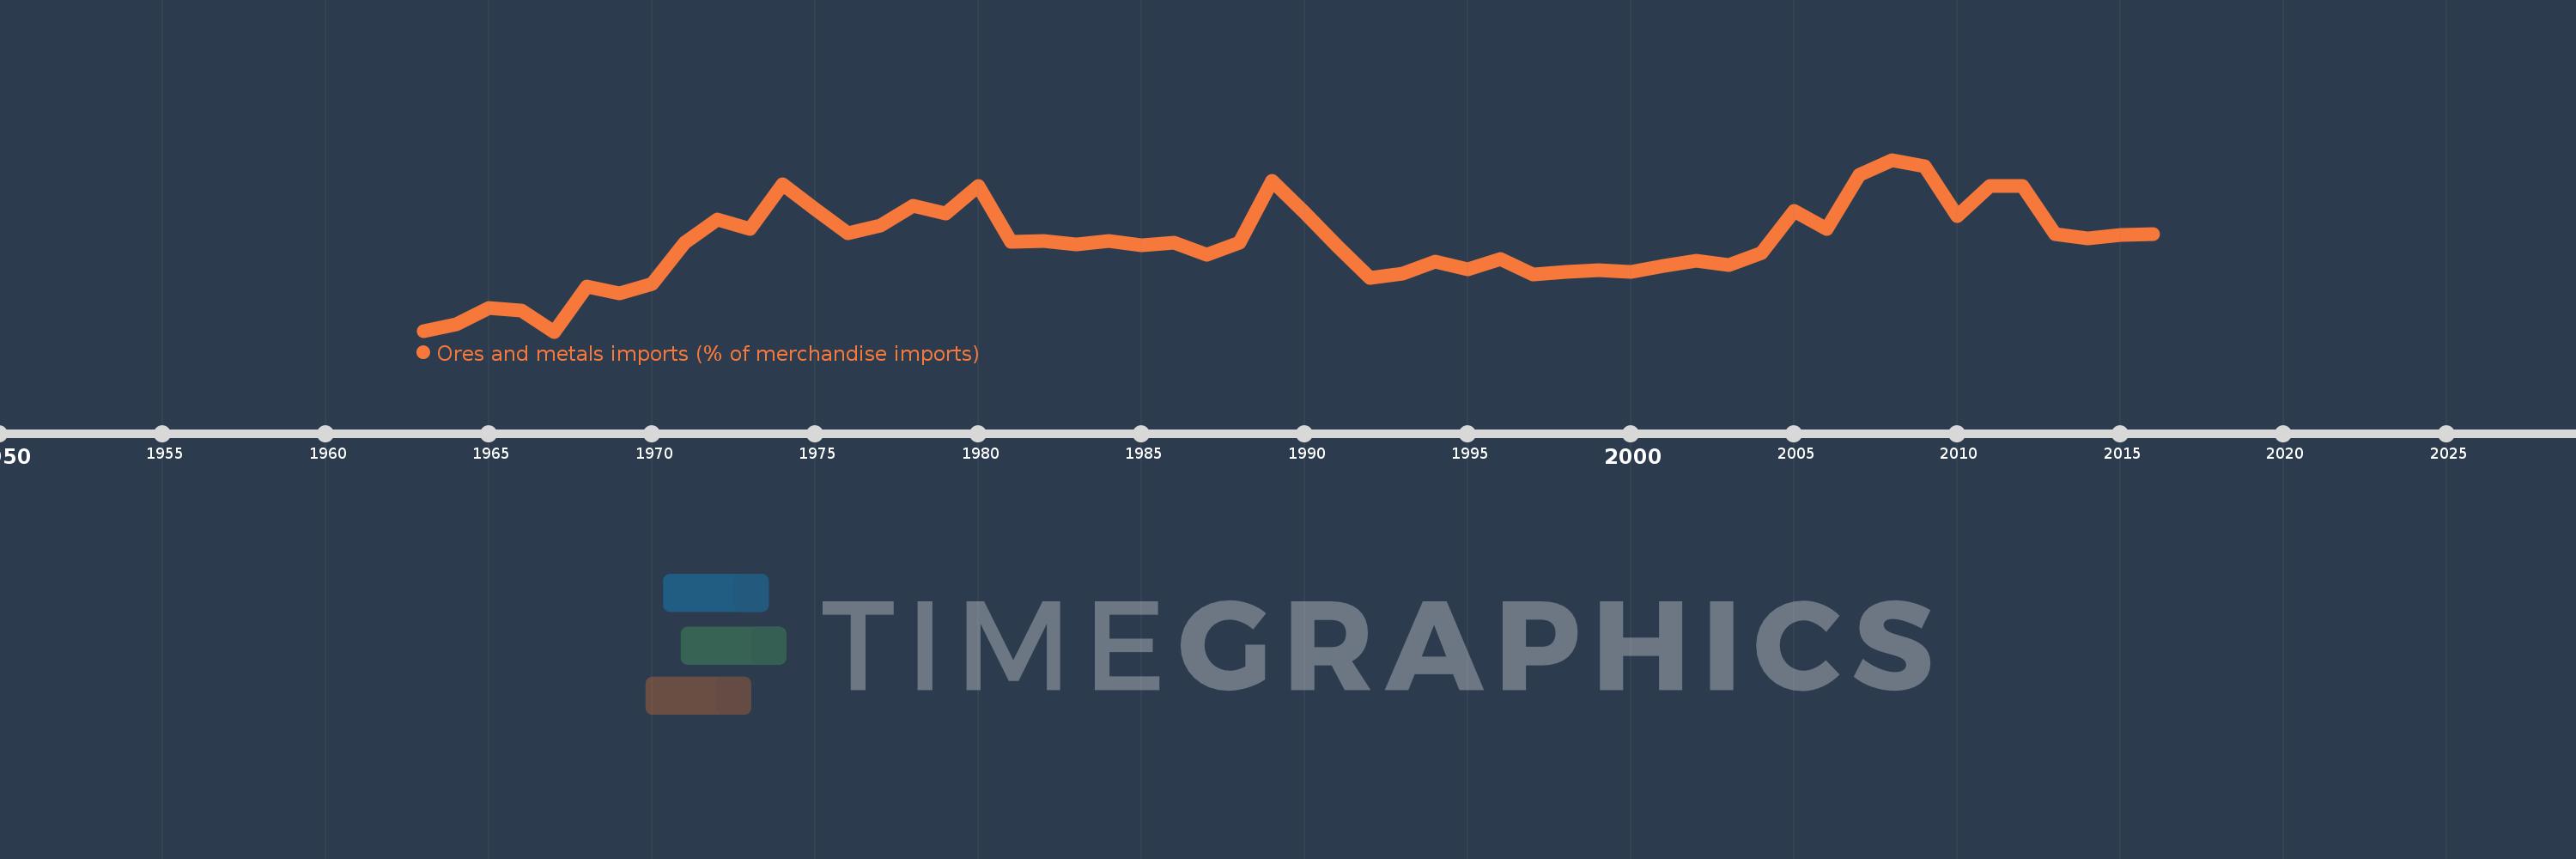
Ores and metals imports (% of merchandise imports)
2016,2015,2014,2013,2012,2011,2010,2009,2008,2007,2006,2005,2004,2003,2002,2001,2000,1999,1998,1997,1996,1995,1994,1993,1992,1991,1990,1989,1988,1987,1986,1985,1984,1983,1982,1981,1980,1979,1978,1977,1976,1975,1974,1973,1972,1971,1970,1969,1968,1967,1966,1965,1964,1963
This statistics in other country:
AfghanistanAlbaniaAlgeriaAndorraAngolaAntigua and BarbudaArab WorldArgentinaArmeniaArubaAustraliaAustriaAzerbaijanBahamas, TheBahrainBangladeshBarbadosBelarusBelgiumBelizeBeninBermudaBhutanBoliviaBosnia and HerzegovinaBotswanaBrazilBrunei DarussalamBulgariaBurkina FasoBurundiCabo VerdeCambodiaCameroonCanadaCaribbean small statesCayman IslandsCentral African RepublicCentral Europe and the BalticsChadChileChinaColombiaComorosCongo, Dem. Rep.Congo, Rep.Costa RicaCote d'IvoireCroatiaCubaCyprusCzech RepublicDenmarkDjiboutiDominicaDominican RepublicEarly-demographic dividendEast Asia & PacificEast Asia & Pacific (excluding high income)East Asia & Pacific (IDA & IBRD countries)EcuadorEgypt, Arab Rep.El SalvadorEquatorial GuineaEritreaEstoniaEthiopiaEuro areaEurope & Central AsiaEurope & Central Asia (excluding high income)Europe & Central Asia (IDA & IBRD countries)European UnionFaroe IslandsFijiFinlandFragile and conflict affected situationsFranceFrench PolynesiaGabonGambia, TheGeorgiaGermanyGhanaGreeceGreenlandGrenadaGuatemalaGuineaGuinea-BissauGuyanaHaitiHeavily indebted poor countries (HIPC)High incomeHondurasHong Kong SAR, ChinaHungaryIBRD onlyIcelandIDA & IBRD totalIDA blendIDA onlyIDA totalIndiaIndonesiaIran, Islamic Rep.IraqIrelandIsraelItalyJamaicaJapanJordanKazakhstanKenyaKiribatiKorea, Rep.KuwaitKyrgyz RepublicLao PDRLate-demographic dividendLatin America & Caribbean Latin America & Caribbean (excluding high income)Latin America & the Caribbean (IDA & IBRD countries)LatviaLeast developed countries: UN classificationLebanonLesothoLiberiaLibyaLithuaniaLow & middle incomeLow incomeLower middle incomeLuxembourgMacao SAR, ChinaMacedonia, FYRMadagascarMalawiMalaysiaMaldivesMaliMaltaMauritaniaMauritiusMexicoMiddle East & North AfricaMiddle East & North Africa (excluding high income)Middle East & North Africa (IDA & IBRD countries)Middle incomeMoldovaMongoliaMoroccoMozambiqueMyanmarNamibiaNepalNetherlandsNew CaledoniaNew ZealandNicaraguaNigerNigeriaNorth AmericaNorwayOECD membersOmanOther small statesPacific island small statesPakistanPalauPanamaPapua New GuineaParaguayPeruPhilippinesPolandPortugalPost-demographic dividendPre-demographic dividendQatarRomaniaRussian FederationRwandaSamoaSao Tome and PrincipeSaudi ArabiaSenegalSerbiaSeychellesSierra LeoneSingaporeSlovak RepublicSloveniaSmall statesSolomon IslandsSomaliaSouth AfricaSouth AsiaSouth Asia (IDA & IBRD)SpainSri LankaSt. Kitts and NevisSt. LuciaSt. Vincent and the GrenadinesSub-Saharan Africa Sub-Saharan Africa (excluding high income)Sub-Saharan Africa (IDA & IBRD countries)SudanSurinameSwazilandSwedenSwitzerlandSyrian Arab RepublicTajikistanTanzaniaThailandTimor-LesteTogoTongaTrinidad and TobagoTunisiaTurkeyTurkmenistanTurks and Caicos IslandsTuvaluUgandaUkraineUnited Arab EmiratesUnited KingdomUnited StatesUpper middle incomeUruguayVanuatuVenezuela, RBVietnamVirgin Islands (U.S.)WorldYemen, Rep.ZambiaZimbabwe Timeline:
This timeline shows a graph from 1963 to 2016 of Thailand. No data until 1962. Number of actual observations by date: 54.
Source name:
World Development Indicators
Source organization:
World Bank staff estimates from the Comtrade database maintained by the United Nations Statistics Division.
Categories, topics:
Energy & Mining, Private Sector, Trade
Last updated:
apr 23, 2017
Indicators value changes by year
At the date of observation
Value
Absolute change
Change from previous value
jan 1, 1963
1.681
+1.681
0.0%
jan 1, 1964
1.825
+0.144
8.56%
jan 1, 1965
2.196
+0.371
20.32%
jan 1, 1966
2.125
-0.071
-3.25%
jan 1, 1967
1.663
-0.462
-21.74%
jan 1, 1968
2.664
+1.001
60.21%
jan 1, 1969
2.526
-0.138
-5.18%
jan 1, 1970
2.728
+0.202
8.0%
jan 1, 1971
3.66
+0.932
34.17%
jan 1, 1972
4.17
+0.51
13.93%
jan 1, 1973
3.959
-0.211
-5.05%
jan 1, 1974
4.954
+0.995
25.13%
jan 1, 1975
4.415
-0.538
-10.87%
jan 1, 1976
3.87
-0.545
-12.35%
jan 1, 1977
4.031
+0.161
4.16%
jan 1, 1978
4.487
+0.456
11.32%
jan 1, 1979
4.302
-0.185
-4.13%
jan 1, 1980
4.918
+0.616
14.32%
jan 1, 1981
3.677
-1.241
-25.24%
jan 1, 1982
3.692
+0.016
0.42%
jan 1, 1983
3.625
-0.068
-1.84%
jan 1, 1984
3.7
+0.076
2.08%
jan 1, 1985
3.599
-0.101
-2.73%
jan 1, 1986
3.663
+0.064
1.77%
jan 1, 1987
3.392
-0.271
-7.39%
jan 1, 1988
3.655
+0.263
7.75%
jan 1, 1989
5.039
+1.384
37.86%
jan 1, 1990
4.329
-0.71
-14.09%
jan 1, 1991
3.573
-0.756
-17.46%
jan 1, 1992
2.859
-0.715
-20.0%
jan 1, 1993
2.964
+0.105
3.67%
jan 1, 1994
3.232
+0.268
9.04%
jan 1, 1995
3.066
-0.166
-5.12%
jan 1, 1996
3.286
+0.22
7.18%
jan 1, 1997
2.949
-0.337
-10.26%
jan 1, 1998
2.996
+0.046
1.57%
jan 1, 1999
3.045
+0.049
1.64%
jan 1, 2000
2.996
-0.049
-1.61%
jan 1, 2001
3.137
+0.141
4.7%
jan 1, 2002
3.243
+0.107
3.4%
jan 1, 2003
3.161
-0.083
-2.54%
jan 1, 2004
3.43
+0.27
8.53%
jan 1, 2005
4.363
+0.932
27.18%
jan 1, 2006
3.969
-0.394
-9.03%
jan 1, 2007
5.181
+1.212
30.55%
jan 1, 2008
5.512
+0.331
6.39%
jan 1, 2009
5.371
-0.142
-2.57%
jan 1, 2010
4.248
-1.123
-20.91%
jan 1, 2011
4.93
+0.683
16.07%
jan 1, 2012
4.93
-0.001
-0.01%
jan 1, 2013
3.846
-1.084
-21.99%
jan 1, 2014
3.749
-0.097
-2.52%
jan 1, 2015
3.832
+0.084
2.23%
jan 1, 2016
3.854
+0.021
0.55%
Ranking of countries by current statistics by years


Comments: