29
/
en
AIzaSyAYiBZKx7MnpbEhh9jyipgxe19OcubqV5w
April 1, 2024
238598
Seychelles
SYC
true
2
1
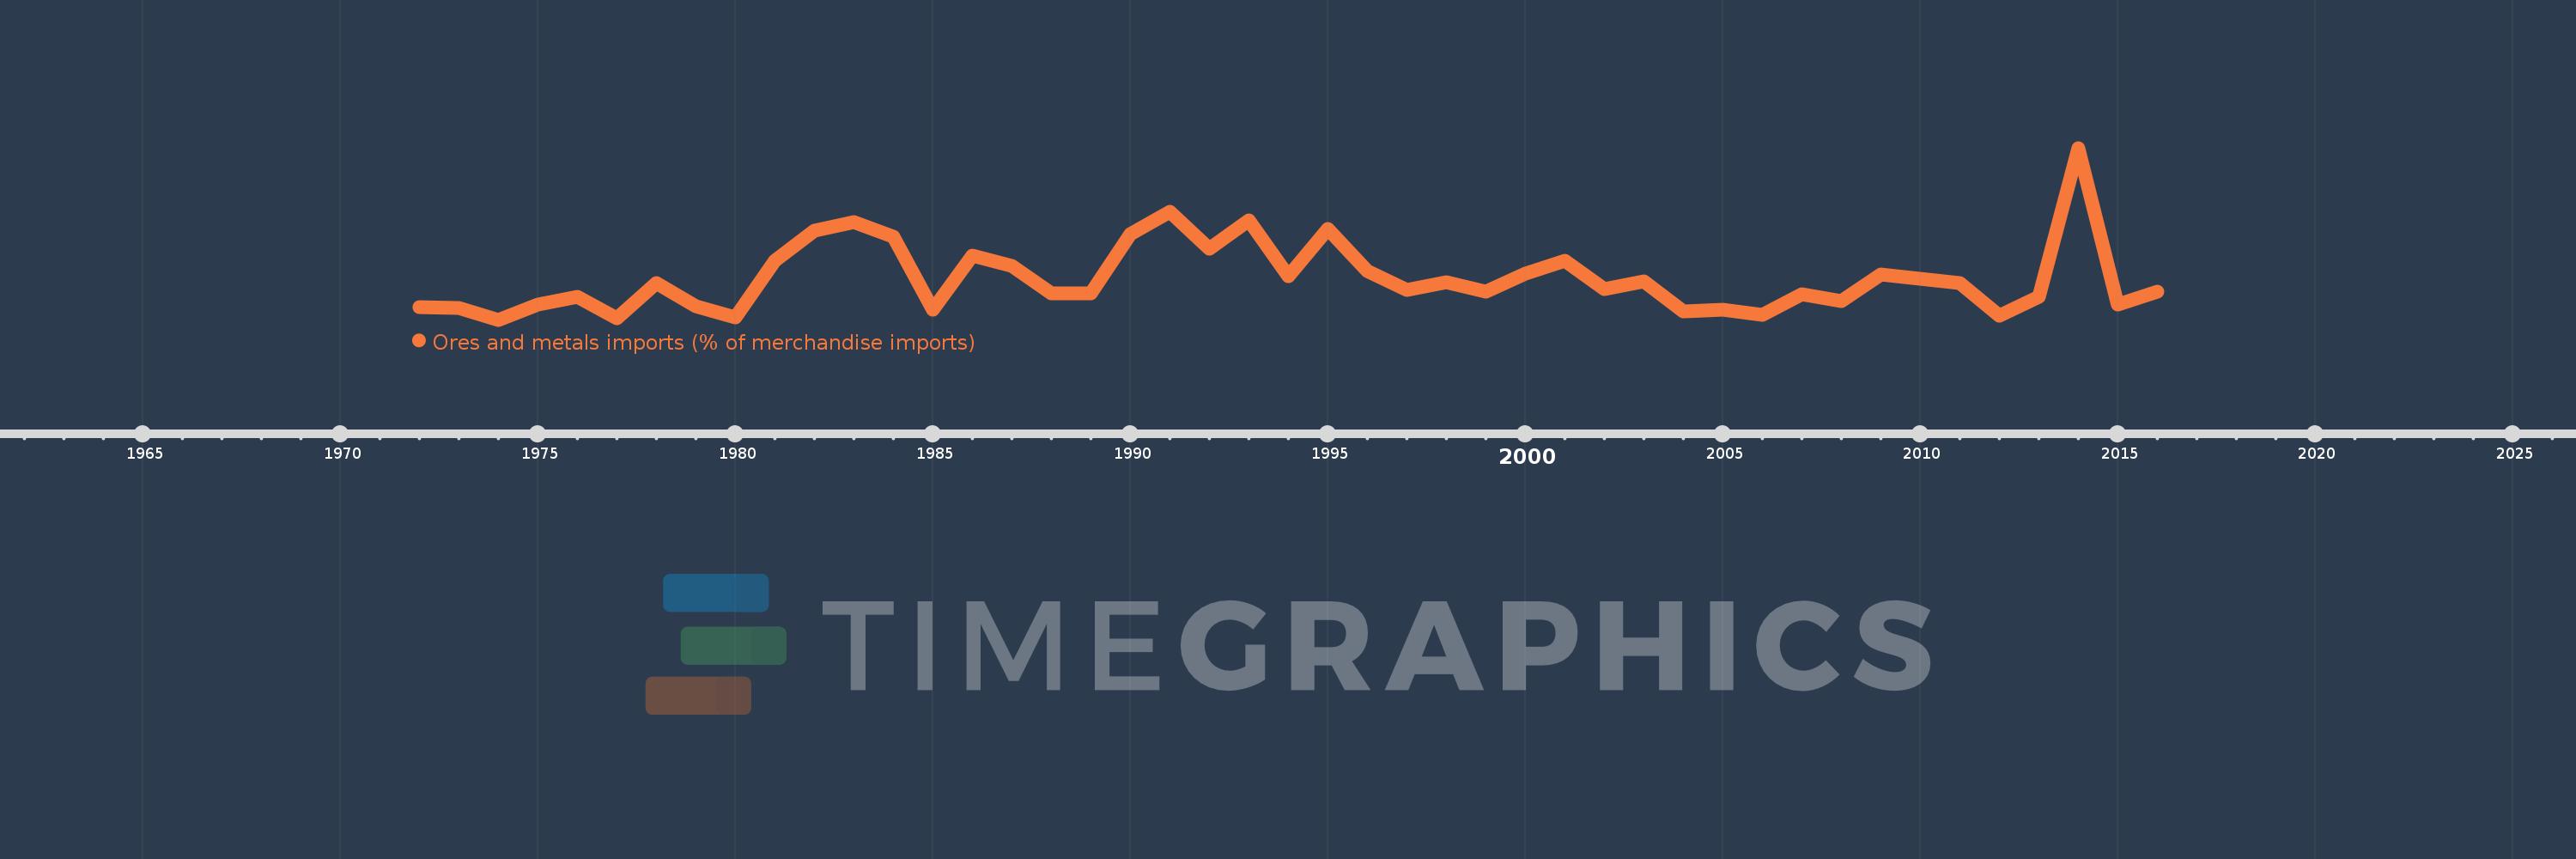
Ores and metals imports (% of merchandise imports)
2016,2015,2014,2013,2012,2011,2009,2008,2007,2006,2005,2004,2003,2002,2001,2000,1999,1998,1997,1996,1995,1994,1993,1992,1991,1990,1989,1988,1987,1986,1985,1984,1983,1982,1981,1980,1979,1978,1977,1976,1975,1974,1973,1972
This statistics in other country:
AfghanistanAlbaniaAlgeriaAndorraAngolaAntigua and BarbudaArab WorldArgentinaArmeniaArubaAustraliaAustriaAzerbaijanBahamas, TheBahrainBangladeshBarbadosBelarusBelgiumBelizeBeninBermudaBhutanBoliviaBosnia and HerzegovinaBotswanaBrazilBrunei DarussalamBulgariaBurkina FasoBurundiCabo VerdeCambodiaCameroonCanadaCaribbean small statesCayman IslandsCentral African RepublicCentral Europe and the BalticsChadChileChinaColombiaComorosCongo, Dem. Rep.Congo, Rep.Costa RicaCote d'IvoireCroatiaCubaCyprusCzech RepublicDenmarkDjiboutiDominicaDominican RepublicEarly-demographic dividendEast Asia & PacificEast Asia & Pacific (excluding high income)East Asia & Pacific (IDA & IBRD countries)EcuadorEgypt, Arab Rep.El SalvadorEquatorial GuineaEritreaEstoniaEthiopiaEuro areaEurope & Central AsiaEurope & Central Asia (excluding high income)Europe & Central Asia (IDA & IBRD countries)European UnionFaroe IslandsFijiFinlandFragile and conflict affected situationsFranceFrench PolynesiaGabonGambia, TheGeorgiaGermanyGhanaGreeceGreenlandGrenadaGuatemalaGuineaGuinea-BissauGuyanaHaitiHeavily indebted poor countries (HIPC)High incomeHondurasHong Kong SAR, ChinaHungaryIBRD onlyIcelandIDA & IBRD totalIDA blendIDA onlyIDA totalIndiaIndonesiaIran, Islamic Rep.IraqIrelandIsraelItalyJamaicaJapanJordanKazakhstanKenyaKiribatiKorea, Rep.KuwaitKyrgyz RepublicLao PDRLate-demographic dividendLatin America & Caribbean Latin America & Caribbean (excluding high income)Latin America & the Caribbean (IDA & IBRD countries)LatviaLeast developed countries: UN classificationLebanonLesothoLiberiaLibyaLithuaniaLow & middle incomeLow incomeLower middle incomeLuxembourgMacao SAR, ChinaMacedonia, FYRMadagascarMalawiMalaysiaMaldivesMaliMaltaMauritaniaMauritiusMexicoMiddle East & North AfricaMiddle East & North Africa (excluding high income)Middle East & North Africa (IDA & IBRD countries)Middle incomeMoldovaMongoliaMoroccoMozambiqueMyanmarNamibiaNepalNetherlandsNew CaledoniaNew ZealandNicaraguaNigerNigeriaNorth AmericaNorwayOECD membersOmanOther small statesPacific island small statesPakistanPalauPanamaPapua New GuineaParaguayPeruPhilippinesPolandPortugalPost-demographic dividendPre-demographic dividendQatarRomaniaRussian FederationRwandaSamoaSao Tome and PrincipeSaudi ArabiaSenegalSerbiaSeychellesSierra LeoneSingaporeSlovak RepublicSloveniaSmall statesSolomon IslandsSomaliaSouth AfricaSouth AsiaSouth Asia (IDA & IBRD)SpainSri LankaSt. Kitts and NevisSt. LuciaSt. Vincent and the GrenadinesSub-Saharan Africa Sub-Saharan Africa (excluding high income)Sub-Saharan Africa (IDA & IBRD countries)SudanSurinameSwazilandSwedenSwitzerlandSyrian Arab RepublicTajikistanTanzaniaThailandTimor-LesteTogoTongaTrinidad and TobagoTunisiaTurkeyTurkmenistanTurks and Caicos IslandsTuvaluUgandaUkraineUnited Arab EmiratesUnited KingdomUnited StatesUpper middle incomeUruguayVanuatuVenezuela, RBVietnamVirgin Islands (U.S.)WorldYemen, Rep.ZambiaZimbabwe Timeline:
This timeline shows a graph from 1972 to 2016 of Seychelles. No data until 1971. Number of actual observations by date: 44.
Source name:
World Development Indicators
Source organization:
World Bank staff estimates from the Comtrade database maintained by the United Nations Statistics Division.
Categories, topics:
Energy & Mining, Private Sector, Trade
Last updated:
apr 23, 2017
Indicators value changes by year
At the date of observation
Value
Absolute change
Change from previous value
jan 1, 1972
0.363
+0.363
0.0%
jan 1, 1973
0.352
-0.01
-2.86%
jan 1, 1974
0.253
-0.099
-28.23%
jan 1, 1975
0.383
+0.13
51.43%
jan 1, 1976
0.452
+0.069
18.08%
jan 1, 1977
0.268
-0.184
-40.73%
jan 1, 1978
0.567
+0.299
111.49%
jan 1, 1979
0.369
-0.198
-34.97%
jan 1, 1980
0.27
-0.099
-26.8%
jan 1, 1981
0.762
+0.492
182.24%
jan 1, 1982
1.026
+0.264
34.71%
jan 1, 1983
1.099
+0.073
7.12%
jan 1, 1984
0.97
-0.129
-11.74%
jan 1, 1985
0.34
-0.629
-64.9%
jan 1, 1986
0.806
+0.466
136.84%
jan 1, 1987
0.72
-0.086
-10.67%
jan 1, 1988
0.485
-0.235
-32.66%
jan 1, 1989
0.484
-0.001
-0.15%
jan 1, 1990
0.992
+0.507
104.74%
jan 1, 1991
1.185
+0.193
19.46%
jan 1, 1992
0.865
-0.319
-26.96%
jan 1, 1993
1.112
+0.246
28.48%
jan 1, 1994
0.627
-0.485
-43.63%
jan 1, 1995
1.039
+0.412
65.78%
jan 1, 1996
0.677
-0.362
-34.85%
jan 1, 1997
0.511
-0.166
-24.49%
jan 1, 1998
0.581
+0.07
13.77%
jan 1, 1999
0.497
-0.084
-14.53%
jan 1, 2000
0.655
+0.158
31.72%
jan 1, 2001
0.766
+0.112
17.09%
jan 1, 2002
0.515
-0.251
-32.76%
jan 1, 2003
0.588
+0.073
14.08%
jan 1, 2004
0.328
-0.26
-44.21%
jan 1, 2005
0.338
+0.01
3.02%
jan 1, 2006
0.296
-0.041
-12.28%
jan 1, 2007
0.477
+0.181
61.02%
jan 1, 2008
0.411
-0.066
-13.8%
jan 1, 2009
0.648
+0.237
57.54%
jan 1, 2011
0.57
-0.079
-12.12%
jan 1, 2012
0.288
-0.282
-49.47%
jan 1, 2013
0.448
+0.16
55.73%
jan 1, 2014
1.741
+1.293
288.48%
jan 1, 2015
0.387
-1.354
-77.76%
jan 1, 2016
0.498
+0.111
28.54%
Ranking of countries by current statistics by years


Comments: