29
/
en
AIzaSyAYiBZKx7MnpbEhh9jyipgxe19OcubqV5w
April 1, 2024
134447
France
FRA
true
2
1
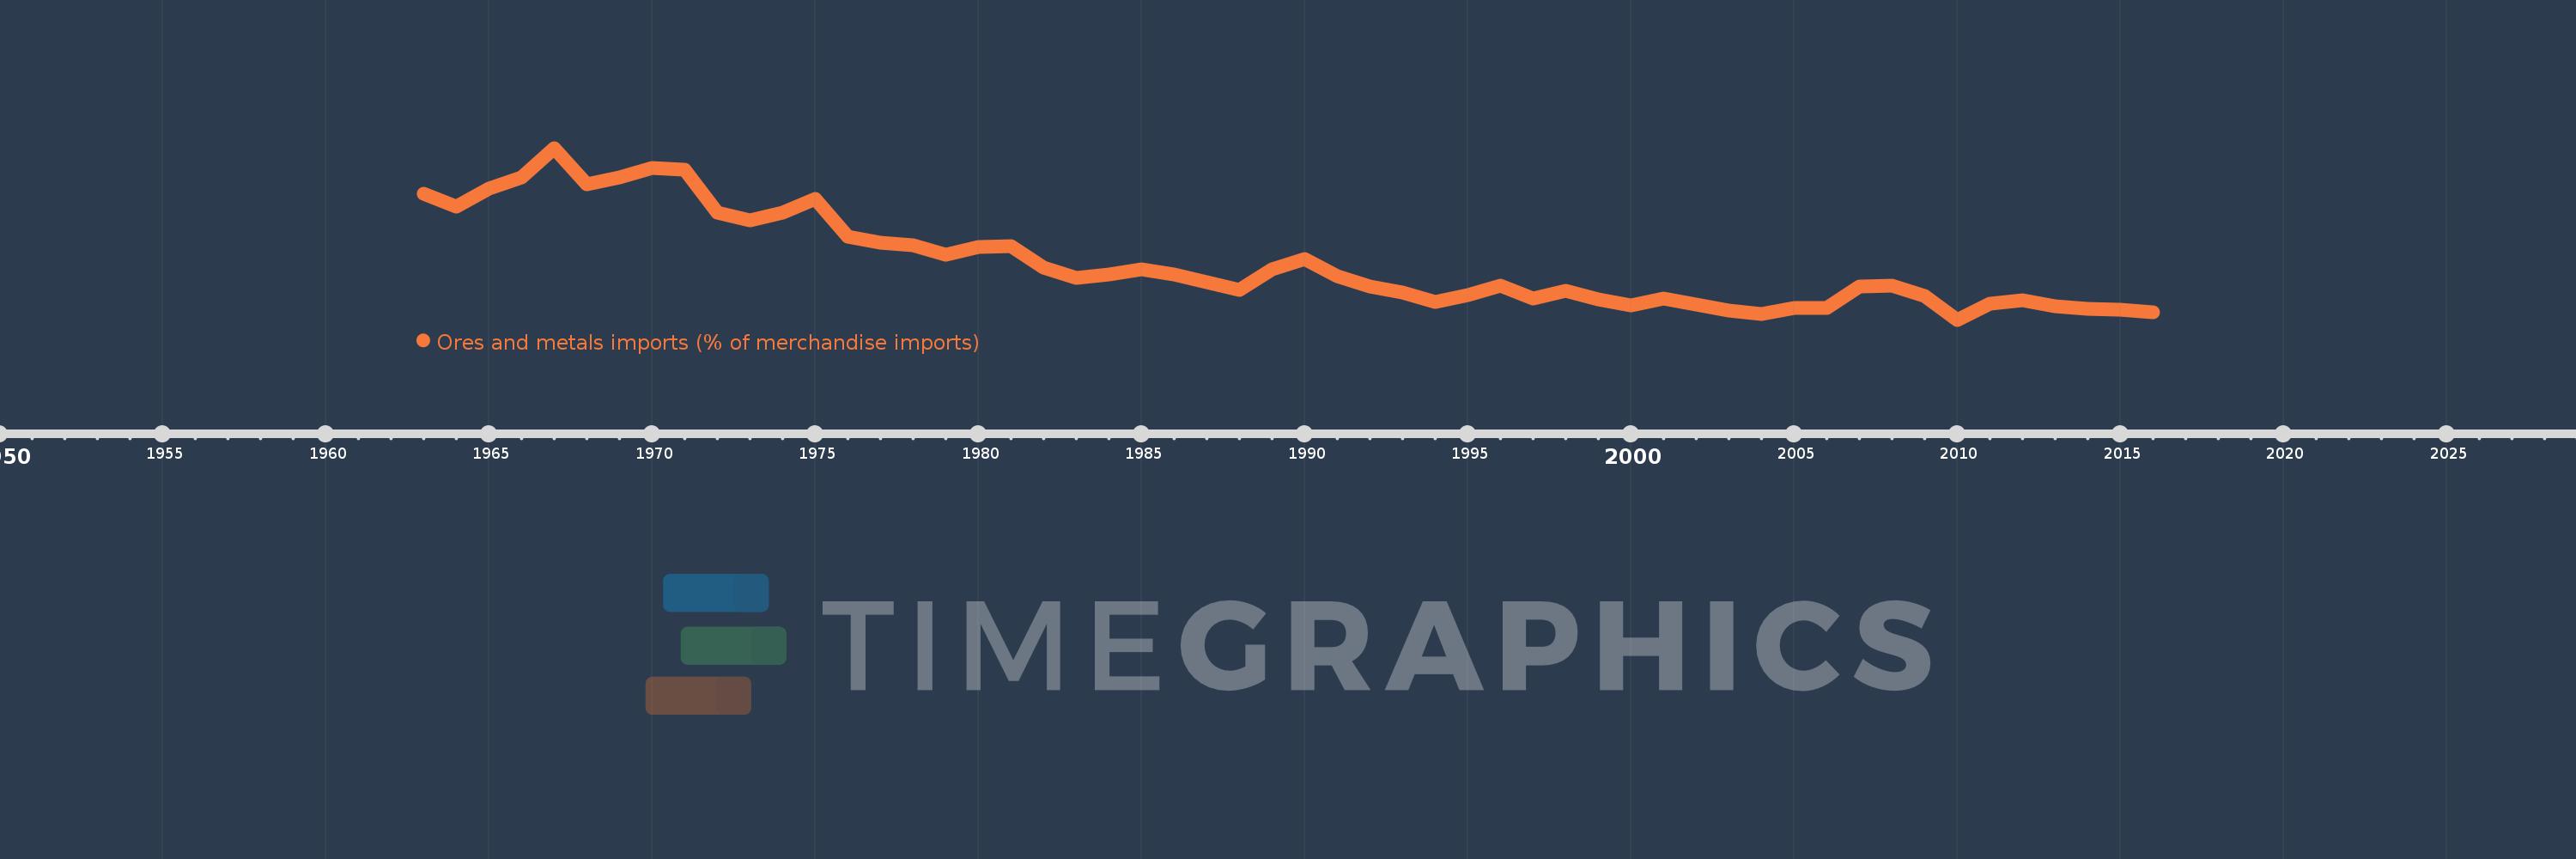
Ores and metals imports (% of merchandise imports)
2016,2015,2014,2013,2012,2011,2010,2009,2008,2007,2006,2005,2004,2003,2002,2001,2000,1999,1998,1997,1996,1995,1994,1993,1992,1991,1990,1989,1988,1987,1986,1985,1984,1983,1982,1981,1980,1979,1978,1977,1976,1975,1974,1973,1972,1971,1970,1969,1968,1967,1966,1965,1964,1963
This statistics in other country:
AfghanistanAlbaniaAlgeriaAndorraAngolaAntigua and BarbudaArab WorldArgentinaArmeniaArubaAustraliaAustriaAzerbaijanBahamas, TheBahrainBangladeshBarbadosBelarusBelgiumBelizeBeninBermudaBhutanBoliviaBosnia and HerzegovinaBotswanaBrazilBrunei DarussalamBulgariaBurkina FasoBurundiCabo VerdeCambodiaCameroonCanadaCaribbean small statesCayman IslandsCentral African RepublicCentral Europe and the BalticsChadChileChinaColombiaComorosCongo, Dem. Rep.Congo, Rep.Costa RicaCote d'IvoireCroatiaCubaCyprusCzech RepublicDenmarkDjiboutiDominicaDominican RepublicEarly-demographic dividendEast Asia & PacificEast Asia & Pacific (excluding high income)East Asia & Pacific (IDA & IBRD countries)EcuadorEgypt, Arab Rep.El SalvadorEquatorial GuineaEritreaEstoniaEthiopiaEuro areaEurope & Central AsiaEurope & Central Asia (excluding high income)Europe & Central Asia (IDA & IBRD countries)European UnionFaroe IslandsFijiFinlandFragile and conflict affected situationsFranceFrench PolynesiaGabonGambia, TheGeorgiaGermanyGhanaGreeceGreenlandGrenadaGuatemalaGuineaGuinea-BissauGuyanaHaitiHeavily indebted poor countries (HIPC)High incomeHondurasHong Kong SAR, ChinaHungaryIBRD onlyIcelandIDA & IBRD totalIDA blendIDA onlyIDA totalIndiaIndonesiaIran, Islamic Rep.IraqIrelandIsraelItalyJamaicaJapanJordanKazakhstanKenyaKiribatiKorea, Rep.KuwaitKyrgyz RepublicLao PDRLate-demographic dividendLatin America & Caribbean Latin America & Caribbean (excluding high income)Latin America & the Caribbean (IDA & IBRD countries)LatviaLeast developed countries: UN classificationLebanonLesothoLiberiaLibyaLithuaniaLow & middle incomeLow incomeLower middle incomeLuxembourgMacao SAR, ChinaMacedonia, FYRMadagascarMalawiMalaysiaMaldivesMaliMaltaMauritaniaMauritiusMexicoMiddle East & North AfricaMiddle East & North Africa (excluding high income)Middle East & North Africa (IDA & IBRD countries)Middle incomeMoldovaMongoliaMoroccoMozambiqueMyanmarNamibiaNepalNetherlandsNew CaledoniaNew ZealandNicaraguaNigerNigeriaNorth AmericaNorwayOECD membersOmanOther small statesPacific island small statesPakistanPalauPanamaPapua New GuineaParaguayPeruPhilippinesPolandPortugalPost-demographic dividendPre-demographic dividendQatarRomaniaRussian FederationRwandaSamoaSao Tome and PrincipeSaudi ArabiaSenegalSerbiaSeychellesSierra LeoneSingaporeSlovak RepublicSloveniaSmall statesSolomon IslandsSomaliaSouth AfricaSouth AsiaSouth Asia (IDA & IBRD)SpainSri LankaSt. Kitts and NevisSt. LuciaSt. Vincent and the GrenadinesSub-Saharan Africa Sub-Saharan Africa (excluding high income)Sub-Saharan Africa (IDA & IBRD countries)SudanSurinameSwazilandSwedenSwitzerlandSyrian Arab RepublicTajikistanTanzaniaThailandTimor-LesteTogoTongaTrinidad and TobagoTunisiaTurkeyTurkmenistanTurks and Caicos IslandsTuvaluUgandaUkraineUnited Arab EmiratesUnited KingdomUnited StatesUpper middle incomeUruguayVanuatuVenezuela, RBVietnamVirgin Islands (U.S.)WorldYemen, Rep.ZambiaZimbabwe Timeline:
This timeline shows a graph from 1963 to 2016 of France. No data until 1962. Number of actual observations by date: 54.
Source name:
World Development Indicators
Source organization:
World Bank staff estimates from the Comtrade database maintained by the United Nations Statistics Division.
Categories, topics:
Energy & Mining, Private Sector, Trade
Last updated:
apr 23, 2017
Indicators value changes by year
At the date of observation
Value
Absolute change
Change from previous value
jan 1, 1963
7.06
+7.06
0.0%
jan 1, 1964
6.542
-0.518
-7.33%
jan 1, 1965
7.255
+0.713
10.9%
jan 1, 1966
7.695
+0.44
6.07%
jan 1, 1967
8.824
+1.129
14.67%
jan 1, 1968
7.426
-1.398
-15.84%
jan 1, 1969
7.678
+0.251
3.39%
jan 1, 1970
8.06
+0.383
4.99%
jan 1, 1971
7.975
-0.085
-1.06%
jan 1, 1972
6.321
-1.654
-20.73%
jan 1, 1973
6.021
-0.3
-4.75%
jan 1, 1974
6.311
+0.29
4.81%
jan 1, 1975
6.837
+0.526
8.34%
jan 1, 1976
5.391
-1.446
-21.15%
jan 1, 1977
5.163
-0.229
-4.24%
jan 1, 1978
5.046
-0.117
-2.27%
jan 1, 1979
4.709
-0.337
-6.67%
jan 1, 1980
4.988
+0.279
5.91%
jan 1, 1981
5.01
+0.022
0.44%
jan 1, 1982
4.198
-0.812
-16.2%
jan 1, 1983
3.782
-0.416
-9.91%
jan 1, 1984
3.925
+0.143
3.79%
jan 1, 1985
4.124
+0.199
5.07%
jan 1, 1986
3.94
-0.184
-4.47%
jan 1, 1987
3.621
-0.319
-8.08%
jan 1, 1988
3.339
-0.282
-7.79%
jan 1, 1989
4.122
+0.783
23.43%
jan 1, 1990
4.528
+0.406
9.85%
jan 1, 1991
3.858
-0.67
-14.79%
jan 1, 1992
3.48
-0.378
-9.8%
jan 1, 1993
3.221
-0.259
-7.44%
jan 1, 1994
2.87
-0.351
-10.9%
jan 1, 1995
3.148
+0.278
9.67%
jan 1, 1996
3.501
+0.353
11.23%
jan 1, 1997
3.012
-0.489
-13.98%
jan 1, 1998
3.291
+0.279
9.27%
jan 1, 1999
2.958
-0.333
-10.12%
jan 1, 2000
2.719
-0.238
-8.06%
jan 1, 2001
2.983
+0.264
9.69%
jan 1, 2002
2.77
-0.213
-7.14%
jan 1, 2003
2.517
-0.253
-9.12%
jan 1, 2004
2.394
-0.124
-4.91%
jan 1, 2005
2.634
+0.24
10.04%
jan 1, 2006
2.629
-0.005
-0.17%
jan 1, 2007
3.463
+0.834
31.71%
jan 1, 2008
3.513
+0.05
1.44%
jan 1, 2009
3.093
-0.42
-11.95%
jan 1, 2010
2.178
-0.915
-29.57%
jan 1, 2011
2.811
+0.633
29.04%
jan 1, 2012
2.939
+0.128
4.55%
jan 1, 2013
2.691
-0.248
-8.44%
jan 1, 2014
2.601
-0.09
-3.36%
jan 1, 2015
2.562
-0.039
-1.48%
jan 1, 2016
2.464
-0.098
-3.84%
Ranking of countries by current statistics by years


Comments: