29
/
en
AIzaSyAYiBZKx7MnpbEhh9jyipgxe19OcubqV5w
April 1, 2024
142622
Greenland
GRL
true
2
1
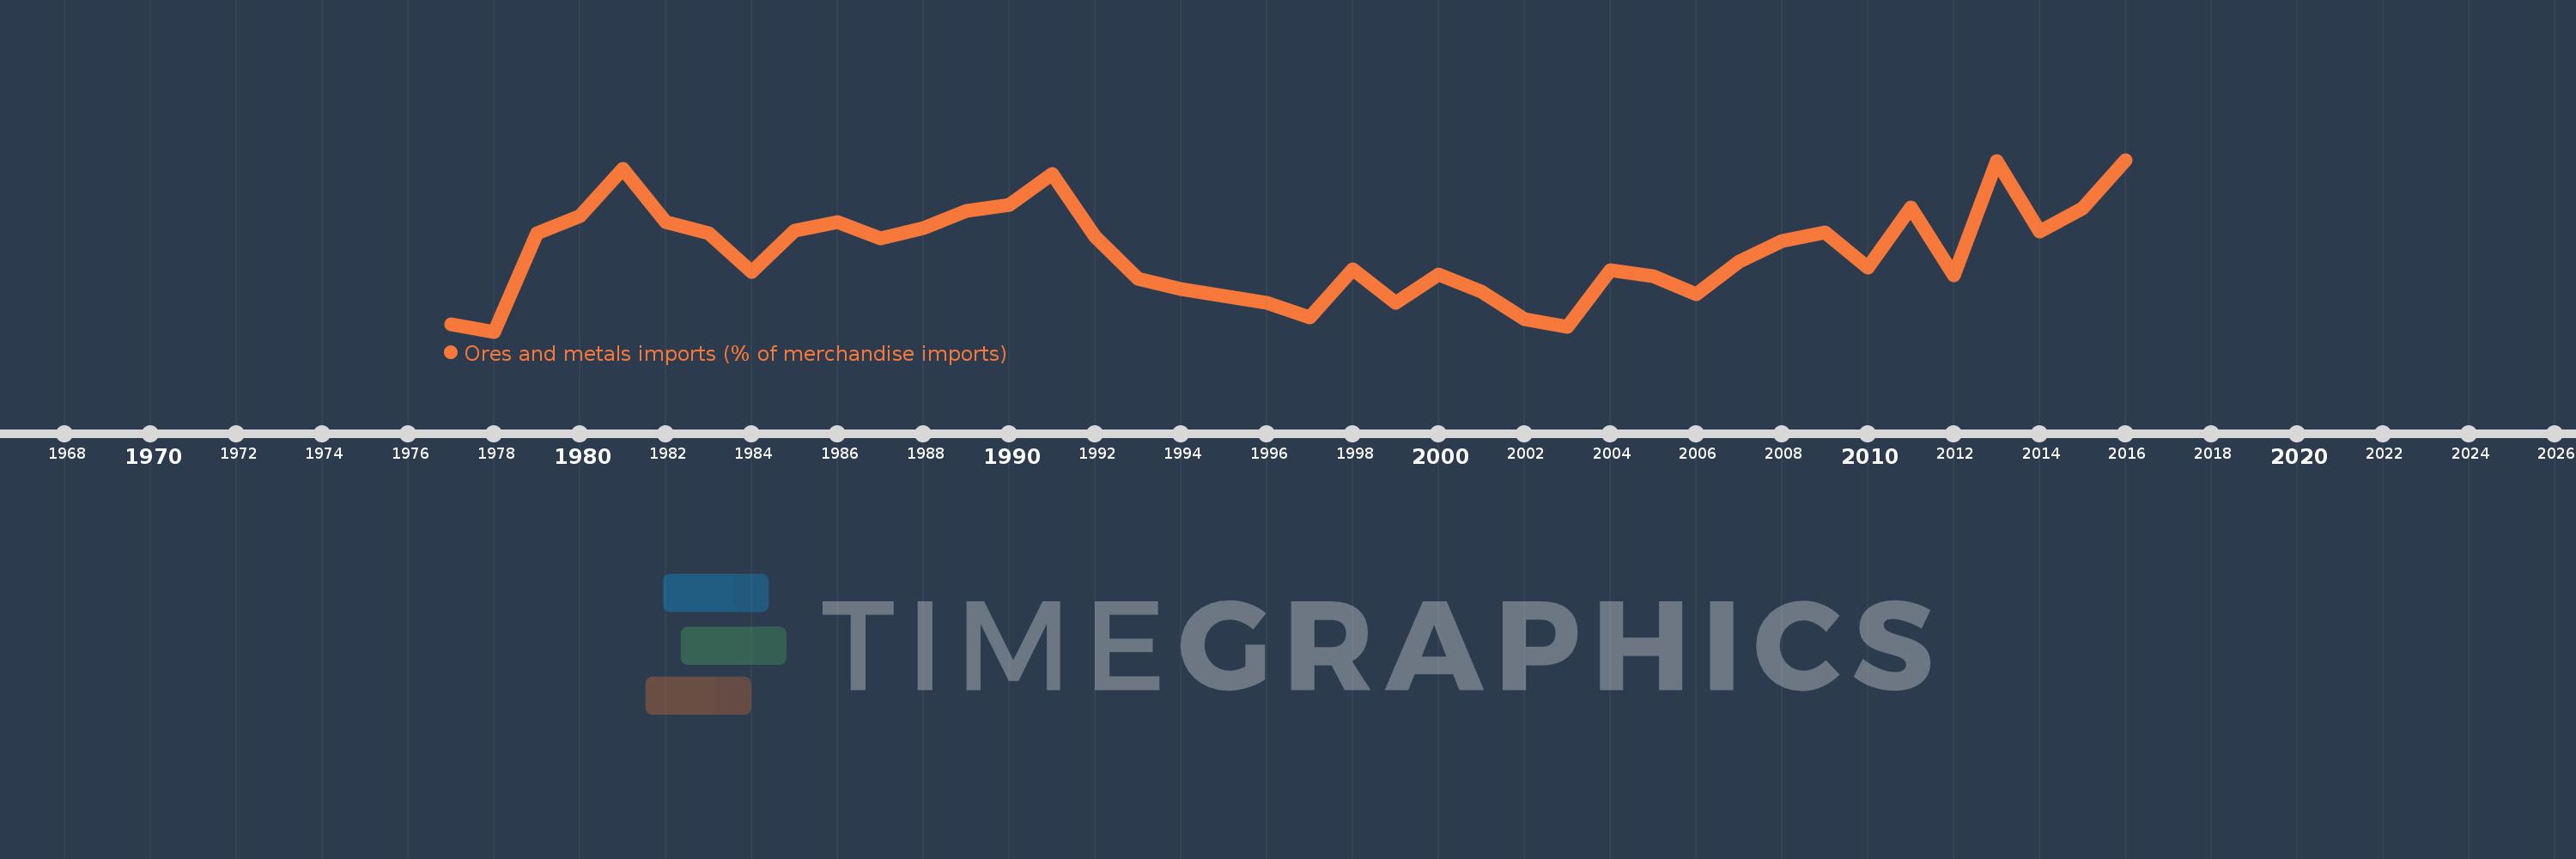
Ores and metals imports (% of merchandise imports)
2016,2015,2014,2013,2012,2011,2010,2009,2008,2007,2006,2005,2004,2003,2002,2001,2000,1999,1998,1997,1996,1994,1993,1992,1991,1990,1989,1988,1987,1986,1985,1984,1983,1982,1981,1980,1979,1978,1977
This statistics in other country:
AfghanistanAlbaniaAlgeriaAndorraAngolaAntigua and BarbudaArab WorldArgentinaArmeniaArubaAustraliaAustriaAzerbaijanBahamas, TheBahrainBangladeshBarbadosBelarusBelgiumBelizeBeninBermudaBhutanBoliviaBosnia and HerzegovinaBotswanaBrazilBrunei DarussalamBulgariaBurkina FasoBurundiCabo VerdeCambodiaCameroonCanadaCaribbean small statesCayman IslandsCentral African RepublicCentral Europe and the BalticsChadChileChinaColombiaComorosCongo, Dem. Rep.Congo, Rep.Costa RicaCote d'IvoireCroatiaCubaCyprusCzech RepublicDenmarkDjiboutiDominicaDominican RepublicEarly-demographic dividendEast Asia & PacificEast Asia & Pacific (excluding high income)East Asia & Pacific (IDA & IBRD countries)EcuadorEgypt, Arab Rep.El SalvadorEquatorial GuineaEritreaEstoniaEthiopiaEuro areaEurope & Central AsiaEurope & Central Asia (excluding high income)Europe & Central Asia (IDA & IBRD countries)European UnionFaroe IslandsFijiFinlandFragile and conflict affected situationsFranceFrench PolynesiaGabonGambia, TheGeorgiaGermanyGhanaGreeceGreenlandGrenadaGuatemalaGuineaGuinea-BissauGuyanaHaitiHeavily indebted poor countries (HIPC)High incomeHondurasHong Kong SAR, ChinaHungaryIBRD onlyIcelandIDA & IBRD totalIDA blendIDA onlyIDA totalIndiaIndonesiaIran, Islamic Rep.IraqIrelandIsraelItalyJamaicaJapanJordanKazakhstanKenyaKiribatiKorea, Rep.KuwaitKyrgyz RepublicLao PDRLate-demographic dividendLatin America & Caribbean Latin America & Caribbean (excluding high income)Latin America & the Caribbean (IDA & IBRD countries)LatviaLeast developed countries: UN classificationLebanonLesothoLiberiaLibyaLithuaniaLow & middle incomeLow incomeLower middle incomeLuxembourgMacao SAR, ChinaMacedonia, FYRMadagascarMalawiMalaysiaMaldivesMaliMaltaMauritaniaMauritiusMexicoMiddle East & North AfricaMiddle East & North Africa (excluding high income)Middle East & North Africa (IDA & IBRD countries)Middle incomeMoldovaMongoliaMoroccoMozambiqueMyanmarNamibiaNepalNetherlandsNew CaledoniaNew ZealandNicaraguaNigerNigeriaNorth AmericaNorwayOECD membersOmanOther small statesPacific island small statesPakistanPalauPanamaPapua New GuineaParaguayPeruPhilippinesPolandPortugalPost-demographic dividendPre-demographic dividendQatarRomaniaRussian FederationRwandaSamoaSao Tome and PrincipeSaudi ArabiaSenegalSerbiaSeychellesSierra LeoneSingaporeSlovak RepublicSloveniaSmall statesSolomon IslandsSomaliaSouth AfricaSouth AsiaSouth Asia (IDA & IBRD)SpainSri LankaSt. Kitts and NevisSt. LuciaSt. Vincent and the GrenadinesSub-Saharan Africa Sub-Saharan Africa (excluding high income)Sub-Saharan Africa (IDA & IBRD countries)SudanSurinameSwazilandSwedenSwitzerlandSyrian Arab RepublicTajikistanTanzaniaThailandTimor-LesteTogoTongaTrinidad and TobagoTunisiaTurkeyTurkmenistanTurks and Caicos IslandsTuvaluUgandaUkraineUnited Arab EmiratesUnited KingdomUnited StatesUpper middle incomeUruguayVanuatuVenezuela, RBVietnamVirgin Islands (U.S.)WorldYemen, Rep.ZambiaZimbabwe Timeline:
This timeline shows a graph from 1977 to 2016 of Greenland. No data until 1976. Number of actual observations by date: 39.
Source name:
World Development Indicators
Source organization:
World Bank staff estimates from the Comtrade database maintained by the United Nations Statistics Division.
Categories, topics:
Energy & Mining, Private Sector, Trade
Last updated:
apr 23, 2017
Indicators value changes by year
At the date of observation
Value
Absolute change
Change from previous value
jan 1, 1977
0.335
+0.335
0.0%
jan 1, 1978
0.31
-0.026
-7.65%
jan 1, 1979
0.642
+0.333
107.35%
jan 1, 1980
0.701
+0.059
9.17%
jan 1, 1981
0.86
+0.159
22.63%
jan 1, 1982
0.68
-0.18
-20.89%
jan 1, 1983
0.643
-0.037
-5.49%
jan 1, 1984
0.511
-0.132
-20.49%
jan 1, 1985
0.651
+0.14
27.37%
jan 1, 1986
0.682
+0.031
4.81%
jan 1, 1987
0.627
-0.056
-8.18%
jan 1, 1988
0.661
+0.035
5.53%
jan 1, 1989
0.719
+0.058
8.75%
jan 1, 1990
0.74
+0.021
2.87%
jan 1, 1991
0.845
+0.105
14.19%
jan 1, 1992
0.633
-0.212
-25.11%
jan 1, 1993
0.49
-0.142
-22.48%
jan 1, 1994
0.455
-0.036
-7.27%
jan 1, 1996
0.408
-0.047
-10.25%
jan 1, 1997
0.358
-0.05
-12.37%
jan 1, 1998
0.521
+0.163
45.64%
jan 1, 1999
0.407
-0.114
-21.92%
jan 1, 2000
0.504
+0.098
24.0%
jan 1, 2001
0.445
-0.059
-11.77%
jan 1, 2002
0.351
-0.094
-21.1%
jan 1, 2003
0.327
-0.024
-6.85%
jan 1, 2004
0.519
+0.192
58.86%
jan 1, 2005
0.498
-0.021
-4.13%
jan 1, 2006
0.436
-0.062
-12.36%
jan 1, 2007
0.546
+0.109
25.04%
jan 1, 2008
0.618
+0.072
13.26%
jan 1, 2009
0.646
+0.028
4.6%
jan 1, 2010
0.527
-0.119
-18.45%
jan 1, 2011
0.73
+0.203
38.5%
jan 1, 2012
0.501
-0.229
-31.4%
jan 1, 2013
0.888
+0.387
77.31%
jan 1, 2014
0.65
-0.238
-26.77%
jan 1, 2015
0.729
+0.078
12.04%
jan 1, 2016
0.892
+0.163
22.36%
Ranking of countries by current statistics by years


Comments: