29
/
en
AIzaSyAYiBZKx7MnpbEhh9jyipgxe19OcubqV5w
April 1, 2024
183212
Macao SAR, China
MAC
true
2
1
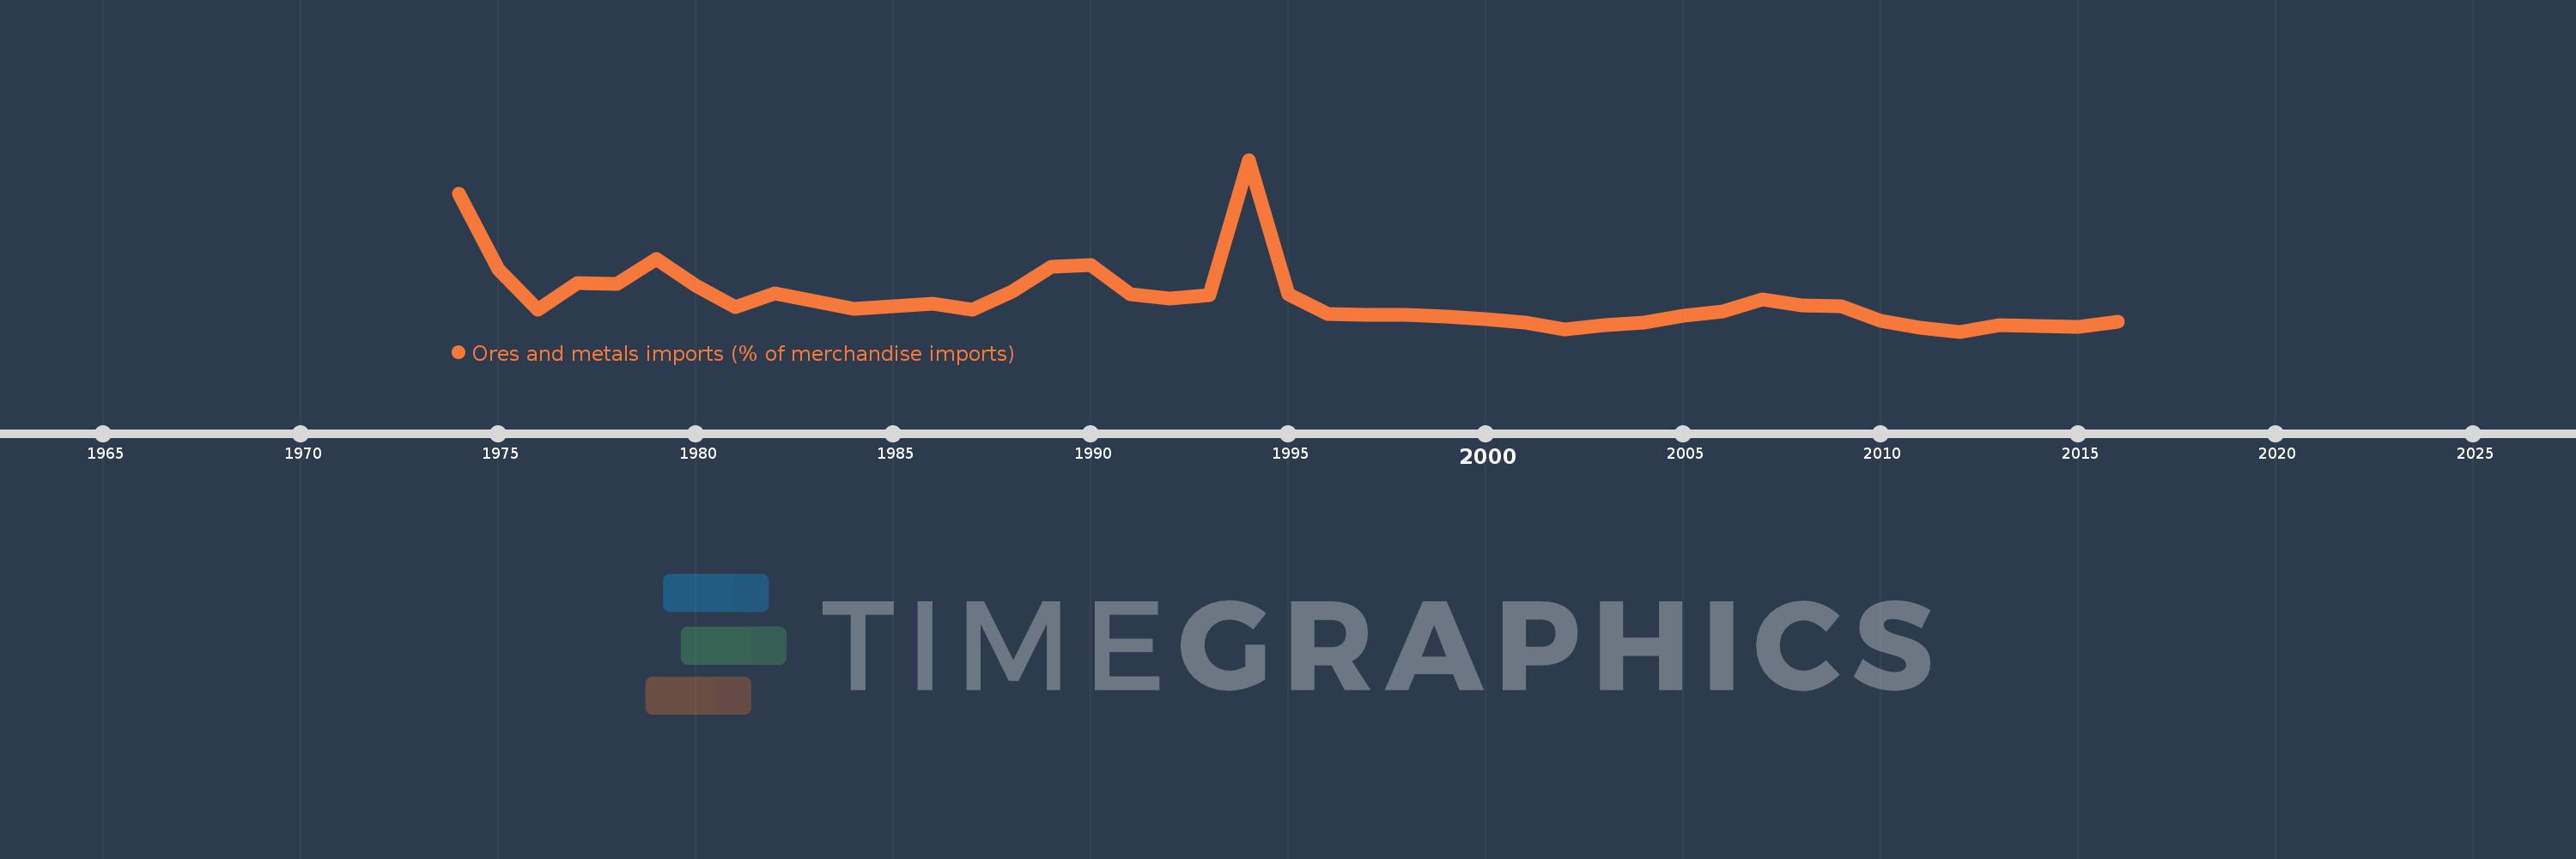
Ores and metals imports (% of merchandise imports)
2016,2015,2013,2012,2011,2010,2009,2008,2007,2006,2005,2004,2003,2002,2001,2000,1999,1998,1997,1996,1995,1994,1993,1992,1991,1990,1989,1988,1987,1986,1985,1984,1982,1981,1980,1979,1978,1977,1976,1975,1974
This statistics in other country:
AfghanistanAlbaniaAlgeriaAndorraAngolaAntigua and BarbudaArab WorldArgentinaArmeniaArubaAustraliaAustriaAzerbaijanBahamas, TheBahrainBangladeshBarbadosBelarusBelgiumBelizeBeninBermudaBhutanBoliviaBosnia and HerzegovinaBotswanaBrazilBrunei DarussalamBulgariaBurkina FasoBurundiCabo VerdeCambodiaCameroonCanadaCaribbean small statesCayman IslandsCentral African RepublicCentral Europe and the BalticsChadChileChinaColombiaComorosCongo, Dem. Rep.Congo, Rep.Costa RicaCote d'IvoireCroatiaCubaCyprusCzech RepublicDenmarkDjiboutiDominicaDominican RepublicEarly-demographic dividendEast Asia & PacificEast Asia & Pacific (excluding high income)East Asia & Pacific (IDA & IBRD countries)EcuadorEgypt, Arab Rep.El SalvadorEquatorial GuineaEritreaEstoniaEthiopiaEuro areaEurope & Central AsiaEurope & Central Asia (excluding high income)Europe & Central Asia (IDA & IBRD countries)European UnionFaroe IslandsFijiFinlandFragile and conflict affected situationsFranceFrench PolynesiaGabonGambia, TheGeorgiaGermanyGhanaGreeceGreenlandGrenadaGuatemalaGuineaGuinea-BissauGuyanaHaitiHeavily indebted poor countries (HIPC)High incomeHondurasHong Kong SAR, ChinaHungaryIBRD onlyIcelandIDA & IBRD totalIDA blendIDA onlyIDA totalIndiaIndonesiaIran, Islamic Rep.IraqIrelandIsraelItalyJamaicaJapanJordanKazakhstanKenyaKiribatiKorea, Rep.KuwaitKyrgyz RepublicLao PDRLate-demographic dividendLatin America & Caribbean Latin America & Caribbean (excluding high income)Latin America & the Caribbean (IDA & IBRD countries)LatviaLeast developed countries: UN classificationLebanonLesothoLiberiaLibyaLithuaniaLow & middle incomeLow incomeLower middle incomeLuxembourgMacao SAR, ChinaMacedonia, FYRMadagascarMalawiMalaysiaMaldivesMaliMaltaMauritaniaMauritiusMexicoMiddle East & North AfricaMiddle East & North Africa (excluding high income)Middle East & North Africa (IDA & IBRD countries)Middle incomeMoldovaMongoliaMoroccoMozambiqueMyanmarNamibiaNepalNetherlandsNew CaledoniaNew ZealandNicaraguaNigerNigeriaNorth AmericaNorwayOECD membersOmanOther small statesPacific island small statesPakistanPalauPanamaPapua New GuineaParaguayPeruPhilippinesPolandPortugalPost-demographic dividendPre-demographic dividendQatarRomaniaRussian FederationRwandaSamoaSao Tome and PrincipeSaudi ArabiaSenegalSerbiaSeychellesSierra LeoneSingaporeSlovak RepublicSloveniaSmall statesSolomon IslandsSomaliaSouth AfricaSouth AsiaSouth Asia (IDA & IBRD)SpainSri LankaSt. Kitts and NevisSt. LuciaSt. Vincent and the GrenadinesSub-Saharan Africa Sub-Saharan Africa (excluding high income)Sub-Saharan Africa (IDA & IBRD countries)SudanSurinameSwazilandSwedenSwitzerlandSyrian Arab RepublicTajikistanTanzaniaThailandTimor-LesteTogoTongaTrinidad and TobagoTunisiaTurkeyTurkmenistanTurks and Caicos IslandsTuvaluUgandaUkraineUnited Arab EmiratesUnited KingdomUnited StatesUpper middle incomeUruguayVanuatuVenezuela, RBVietnamVirgin Islands (U.S.)WorldYemen, Rep.ZambiaZimbabwe Timeline:
This timeline shows a graph from 1974 to 2016 of Macao SAR, China. No data until 1973. Number of actual observations by date: 41.
Source name:
World Development Indicators
Source organization:
World Bank staff estimates from the Comtrade database maintained by the United Nations Statistics Division.
Categories, topics:
Energy & Mining, Private Sector, Trade
Last updated:
apr 23, 2017
Indicators value changes by year
At the date of observation
Value
Absolute change
Change from previous value
jan 1, 1974
3.702
+3.702
0.0%
jan 1, 1975
1.746
-1.956
-52.84%
jan 1, 1976
0.683
-1.063
-60.88%
jan 1, 1977
1.374
+0.691
101.14%
jan 1, 1978
1.365
-0.008
-0.61%
jan 1, 1979
2.005
+0.639
46.81%
jan 1, 1980
1.315
-0.69
-34.42%
jan 1, 1981
0.753
-0.562
-42.72%
jan 1, 1982
1.114
+0.361
47.9%
jan 1, 1984
0.708
-0.405
-36.38%
jan 1, 1985
0.772
+0.064
8.97%
jan 1, 1986
0.856
+0.084
10.94%
jan 1, 1987
0.704
-0.152
-17.8%
jan 1, 1988
1.158
+0.454
64.56%
jan 1, 1989
1.811
+0.652
56.31%
jan 1, 1990
1.845
+0.035
1.91%
jan 1, 1991
1.085
-0.761
-41.23%
jan 1, 1992
0.978
-0.107
-9.85%
jan 1, 1993
1.073
+0.095
9.74%
jan 1, 1994
4.568
+3.495
325.69%
jan 1, 1995
1.101
-3.467
-75.9%
jan 1, 1996
0.584
-0.517
-46.98%
jan 1, 1997
0.564
-0.02
-3.41%
jan 1, 1998
0.567
+0.003
0.6%
jan 1, 1999
0.512
-0.055
-9.66%
jan 1, 2000
0.453
-0.06
-11.64%
jan 1, 2001
0.352
-0.1
-22.16%
jan 1, 2002
0.178
-0.175
-49.62%
jan 1, 2003
0.291
+0.113
63.76%
jan 1, 2004
0.35
+0.059
20.35%
jan 1, 2005
0.543
+0.193
55.3%
jan 1, 2006
0.638
+0.095
17.51%
jan 1, 2007
0.968
+0.329
51.54%
jan 1, 2008
0.809
-0.159
-16.41%
jan 1, 2009
0.772
-0.037
-4.59%
jan 1, 2010
0.405
-0.367
-47.53%
jan 1, 2011
0.236
-0.169
-41.82%
jan 1, 2012
0.127
-0.108
-46.02%
jan 1, 2013
0.287
+0.16
125.57%
jan 1, 2015
0.255
-0.032
-11.15%
jan 1, 2016
0.386
+0.131
51.5%
Ranking of countries by current statistics by years


Comments: