29
/
en
AIzaSyAYiBZKx7MnpbEhh9jyipgxe19OcubqV5w
April 1, 2024
159754
Ireland
IRL
true
2
1
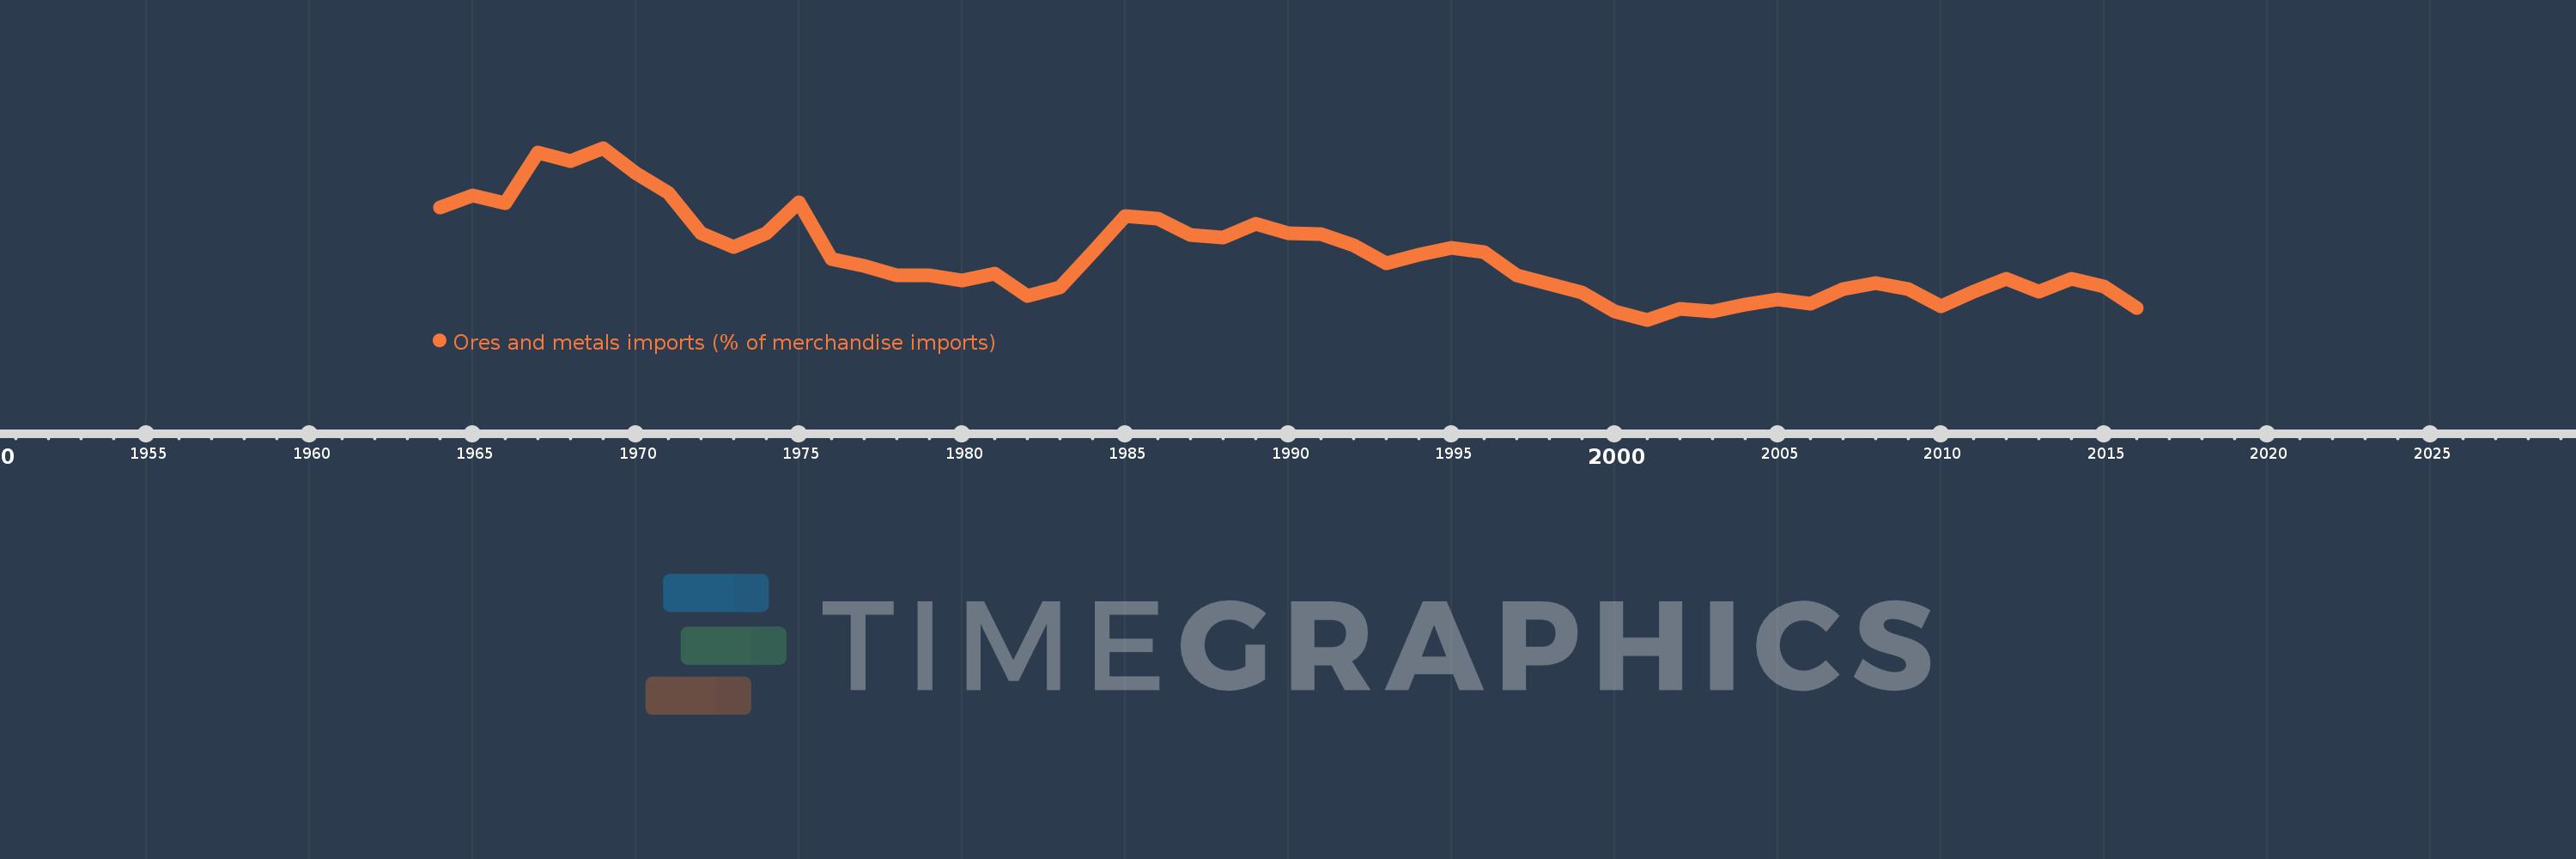
Ores and metals imports (% of merchandise imports)
2016,2015,2014,2013,2012,2011,2010,2009,2008,2007,2006,2005,2004,2003,2002,2001,2000,1999,1998,1997,1996,1995,1994,1993,1992,1991,1990,1989,1988,1987,1986,1985,1984,1983,1982,1981,1980,1979,1978,1977,1976,1975,1974,1973,1972,1971,1970,1969,1968,1967,1966,1965,1964
This statistics in other country:
AfghanistanAlbaniaAlgeriaAndorraAngolaAntigua and BarbudaArab WorldArgentinaArmeniaArubaAustraliaAustriaAzerbaijanBahamas, TheBahrainBangladeshBarbadosBelarusBelgiumBelizeBeninBermudaBhutanBoliviaBosnia and HerzegovinaBotswanaBrazilBrunei DarussalamBulgariaBurkina FasoBurundiCabo VerdeCambodiaCameroonCanadaCaribbean small statesCayman IslandsCentral African RepublicCentral Europe and the BalticsChadChileChinaColombiaComorosCongo, Dem. Rep.Congo, Rep.Costa RicaCote d'IvoireCroatiaCubaCyprusCzech RepublicDenmarkDjiboutiDominicaDominican RepublicEarly-demographic dividendEast Asia & PacificEast Asia & Pacific (excluding high income)East Asia & Pacific (IDA & IBRD countries)EcuadorEgypt, Arab Rep.El SalvadorEquatorial GuineaEritreaEstoniaEthiopiaEuro areaEurope & Central AsiaEurope & Central Asia (excluding high income)Europe & Central Asia (IDA & IBRD countries)European UnionFaroe IslandsFijiFinlandFragile and conflict affected situationsFranceFrench PolynesiaGabonGambia, TheGeorgiaGermanyGhanaGreeceGreenlandGrenadaGuatemalaGuineaGuinea-BissauGuyanaHaitiHeavily indebted poor countries (HIPC)High incomeHondurasHong Kong SAR, ChinaHungaryIBRD onlyIcelandIDA & IBRD totalIDA blendIDA onlyIDA totalIndiaIndonesiaIran, Islamic Rep.IraqIrelandIsraelItalyJamaicaJapanJordanKazakhstanKenyaKiribatiKorea, Rep.KuwaitKyrgyz RepublicLao PDRLate-demographic dividendLatin America & Caribbean Latin America & Caribbean (excluding high income)Latin America & the Caribbean (IDA & IBRD countries)LatviaLeast developed countries: UN classificationLebanonLesothoLiberiaLibyaLithuaniaLow & middle incomeLow incomeLower middle incomeLuxembourgMacao SAR, ChinaMacedonia, FYRMadagascarMalawiMalaysiaMaldivesMaliMaltaMauritaniaMauritiusMexicoMiddle East & North AfricaMiddle East & North Africa (excluding high income)Middle East & North Africa (IDA & IBRD countries)Middle incomeMoldovaMongoliaMoroccoMozambiqueMyanmarNamibiaNepalNetherlandsNew CaledoniaNew ZealandNicaraguaNigerNigeriaNorth AmericaNorwayOECD membersOmanOther small statesPacific island small statesPakistanPalauPanamaPapua New GuineaParaguayPeruPhilippinesPolandPortugalPost-demographic dividendPre-demographic dividendQatarRomaniaRussian FederationRwandaSamoaSao Tome and PrincipeSaudi ArabiaSenegalSerbiaSeychellesSierra LeoneSingaporeSlovak RepublicSloveniaSmall statesSolomon IslandsSomaliaSouth AfricaSouth AsiaSouth Asia (IDA & IBRD)SpainSri LankaSt. Kitts and NevisSt. LuciaSt. Vincent and the GrenadinesSub-Saharan Africa Sub-Saharan Africa (excluding high income)Sub-Saharan Africa (IDA & IBRD countries)SudanSurinameSwazilandSwedenSwitzerlandSyrian Arab RepublicTajikistanTanzaniaThailandTimor-LesteTogoTongaTrinidad and TobagoTunisiaTurkeyTurkmenistanTurks and Caicos IslandsTuvaluUgandaUkraineUnited Arab EmiratesUnited KingdomUnited StatesUpper middle incomeUruguayVanuatuVenezuela, RBVietnamVirgin Islands (U.S.)WorldYemen, Rep.ZambiaZimbabwe Timeline:
This timeline shows a graph from 1964 to 2016 of Ireland. No data until 1963. Number of actual observations by date: 53.
Source name:
World Development Indicators
Source organization:
World Bank staff estimates from the Comtrade database maintained by the United Nations Statistics Division.
Categories, topics:
Energy & Mining, Private Sector, Trade
Last updated:
apr 23, 2017
Indicators value changes by year
At the date of observation
Value
Absolute change
Change from previous value
jan 1, 1964
2.779
+2.779
0.0%
jan 1, 1965
2.946
+0.167
5.99%
jan 1, 1966
2.831
-0.116
-3.92%
jan 1, 1967
3.542
+0.712
25.14%
jan 1, 1968
3.42
-0.123
-3.46%
jan 1, 1969
3.609
+0.19
5.56%
jan 1, 1970
3.256
-0.354
-9.8%
jan 1, 1971
2.975
-0.281
-8.62%
jan 1, 1972
2.419
-0.556
-18.68%
jan 1, 1973
2.226
-0.193
-7.97%
jan 1, 1974
2.409
+0.183
8.22%
jan 1, 1975
2.853
+0.444
18.41%
jan 1, 1976
2.057
-0.796
-27.9%
jan 1, 1977
1.959
-0.098
-4.75%
jan 1, 1978
1.828
-0.131
-6.68%
jan 1, 1979
1.825
-0.004
-0.22%
jan 1, 1980
1.748
-0.076
-4.18%
jan 1, 1981
1.854
+0.106
6.07%
jan 1, 1982
1.542
-0.312
-16.83%
jan 1, 1983
1.655
+0.112
7.29%
jan 1, 1984
2.149
+0.494
29.86%
jan 1, 1985
2.654
+0.506
23.53%
jan 1, 1986
2.614
-0.041
-1.53%
jan 1, 1987
2.39
-0.223
-8.55%
jan 1, 1988
2.353
-0.037
-1.54%
jan 1, 1989
2.549
+0.195
8.29%
jan 1, 1990
2.417
-0.131
-5.16%
jan 1, 1991
2.404
-0.013
-0.55%
jan 1, 1992
2.246
-0.157
-6.55%
jan 1, 1993
1.99
-0.257
-11.43%
jan 1, 1994
2.113
+0.123
6.21%
jan 1, 1995
2.205
+0.092
4.34%
jan 1, 1996
2.147
-0.057
-2.6%
jan 1, 1997
1.825
-0.322
-15.0%
jan 1, 1998
1.701
-0.124
-6.81%
jan 1, 1999
1.585
-0.116
-6.8%
jan 1, 2000
1.317
-0.268
-16.9%
jan 1, 2001
1.204
-0.113
-8.57%
jan 1, 2002
1.354
+0.149
12.38%
jan 1, 2003
1.324
-0.03
-2.21%
jan 1, 2004
1.421
+0.097
7.35%
jan 1, 2005
1.484
+0.063
4.45%
jan 1, 2006
1.43
-0.055
-3.68%
jan 1, 2007
1.632
+0.202
14.15%
jan 1, 2008
1.72
+0.088
5.39%
jan 1, 2009
1.637
-0.083
-4.82%
jan 1, 2010
1.397
-0.24
-14.68%
jan 1, 2011
1.596
+0.199
14.24%
jan 1, 2012
1.781
+0.185
11.6%
jan 1, 2013
1.598
-0.182
-10.23%
jan 1, 2014
1.776
+0.177
11.09%
jan 1, 2015
1.672
-0.104
-5.83%
jan 1, 2016
1.368
-0.305
-18.22%
Ranking of countries by current statistics by years


Comments: